Prices align with basic economic fundamentals. When inventories are low, prices climb and vice versa.
Studying the cyclic nature of metals markets reveals some interesting trends
By John E. Gross
Spot copper on Comex rose to a record high $4.78/lb on May 11, 2021, thereby surpassing its previous high of $4.62/lb set in February 2011. Between these two price points, however, copper experienced considerable volatility, with the market falling to $1.94 in January 2016.
Of course, copper is not alone with significant swings in the market, as prices for other base metals including aluminum, lead, tin, nickel and zinc that are traded on international commodity exchanges are all subject to significant fluctuations. And if base metals are volatile, precious metal prices can be explosive. Why is this?
The question asked each and every day by people around the world is: Why did the market do what it did today? And just as frequently, where do you think the market is going from here? Invariably, every time the question is raised, a multitude of different opinions will be the answer.
What Drives Metal Markets?
A long look back at history tells us that markets are cyclical. There are periods of strong economic activity resulting in rising demand for metals, to the extent it may exceed available supply, thereby causing prices to rise. In response to higher prices, mining companies will be encouraged to increase production to take advantage of the higher values.
Another way of saying this is, demand drives price, and price drives production.
We all know there is a long lead time to add capacity and ramp up production, and once the decision is made to do so, it is very difficult to reverse. The demand side, however, is subject to short-term changes in economic conditions, or other factors that may cause consumption of metal to decline just as production is rising, resulting in excess supply, higher inventories and consequently lower prices.
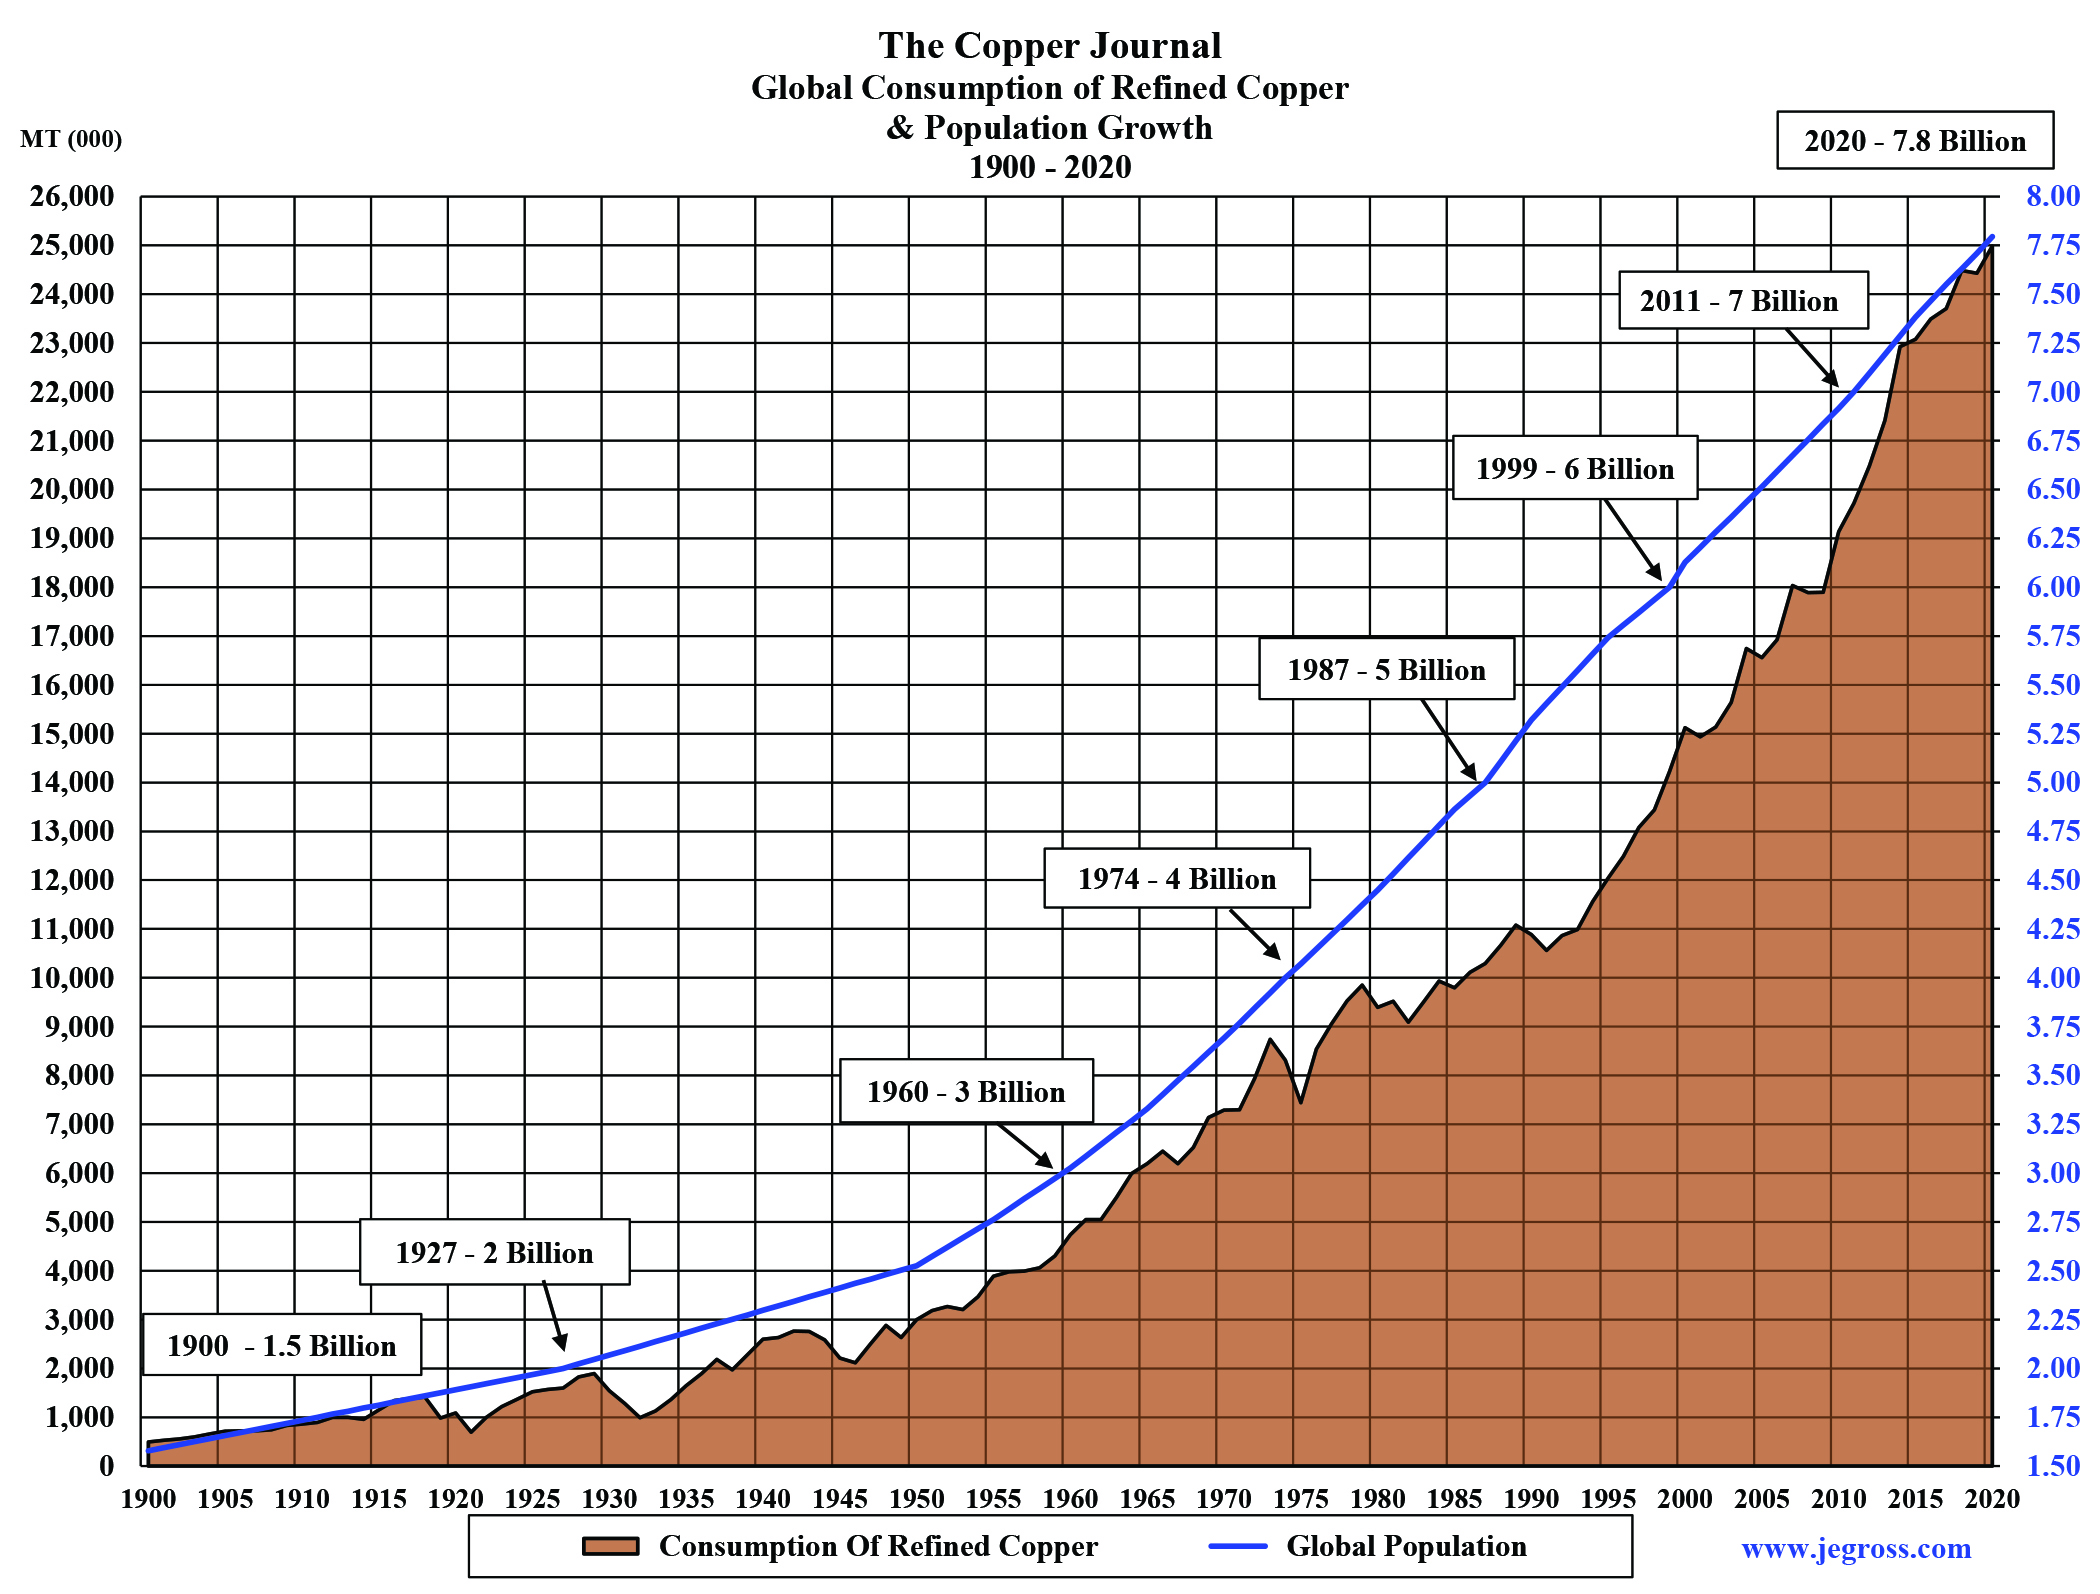
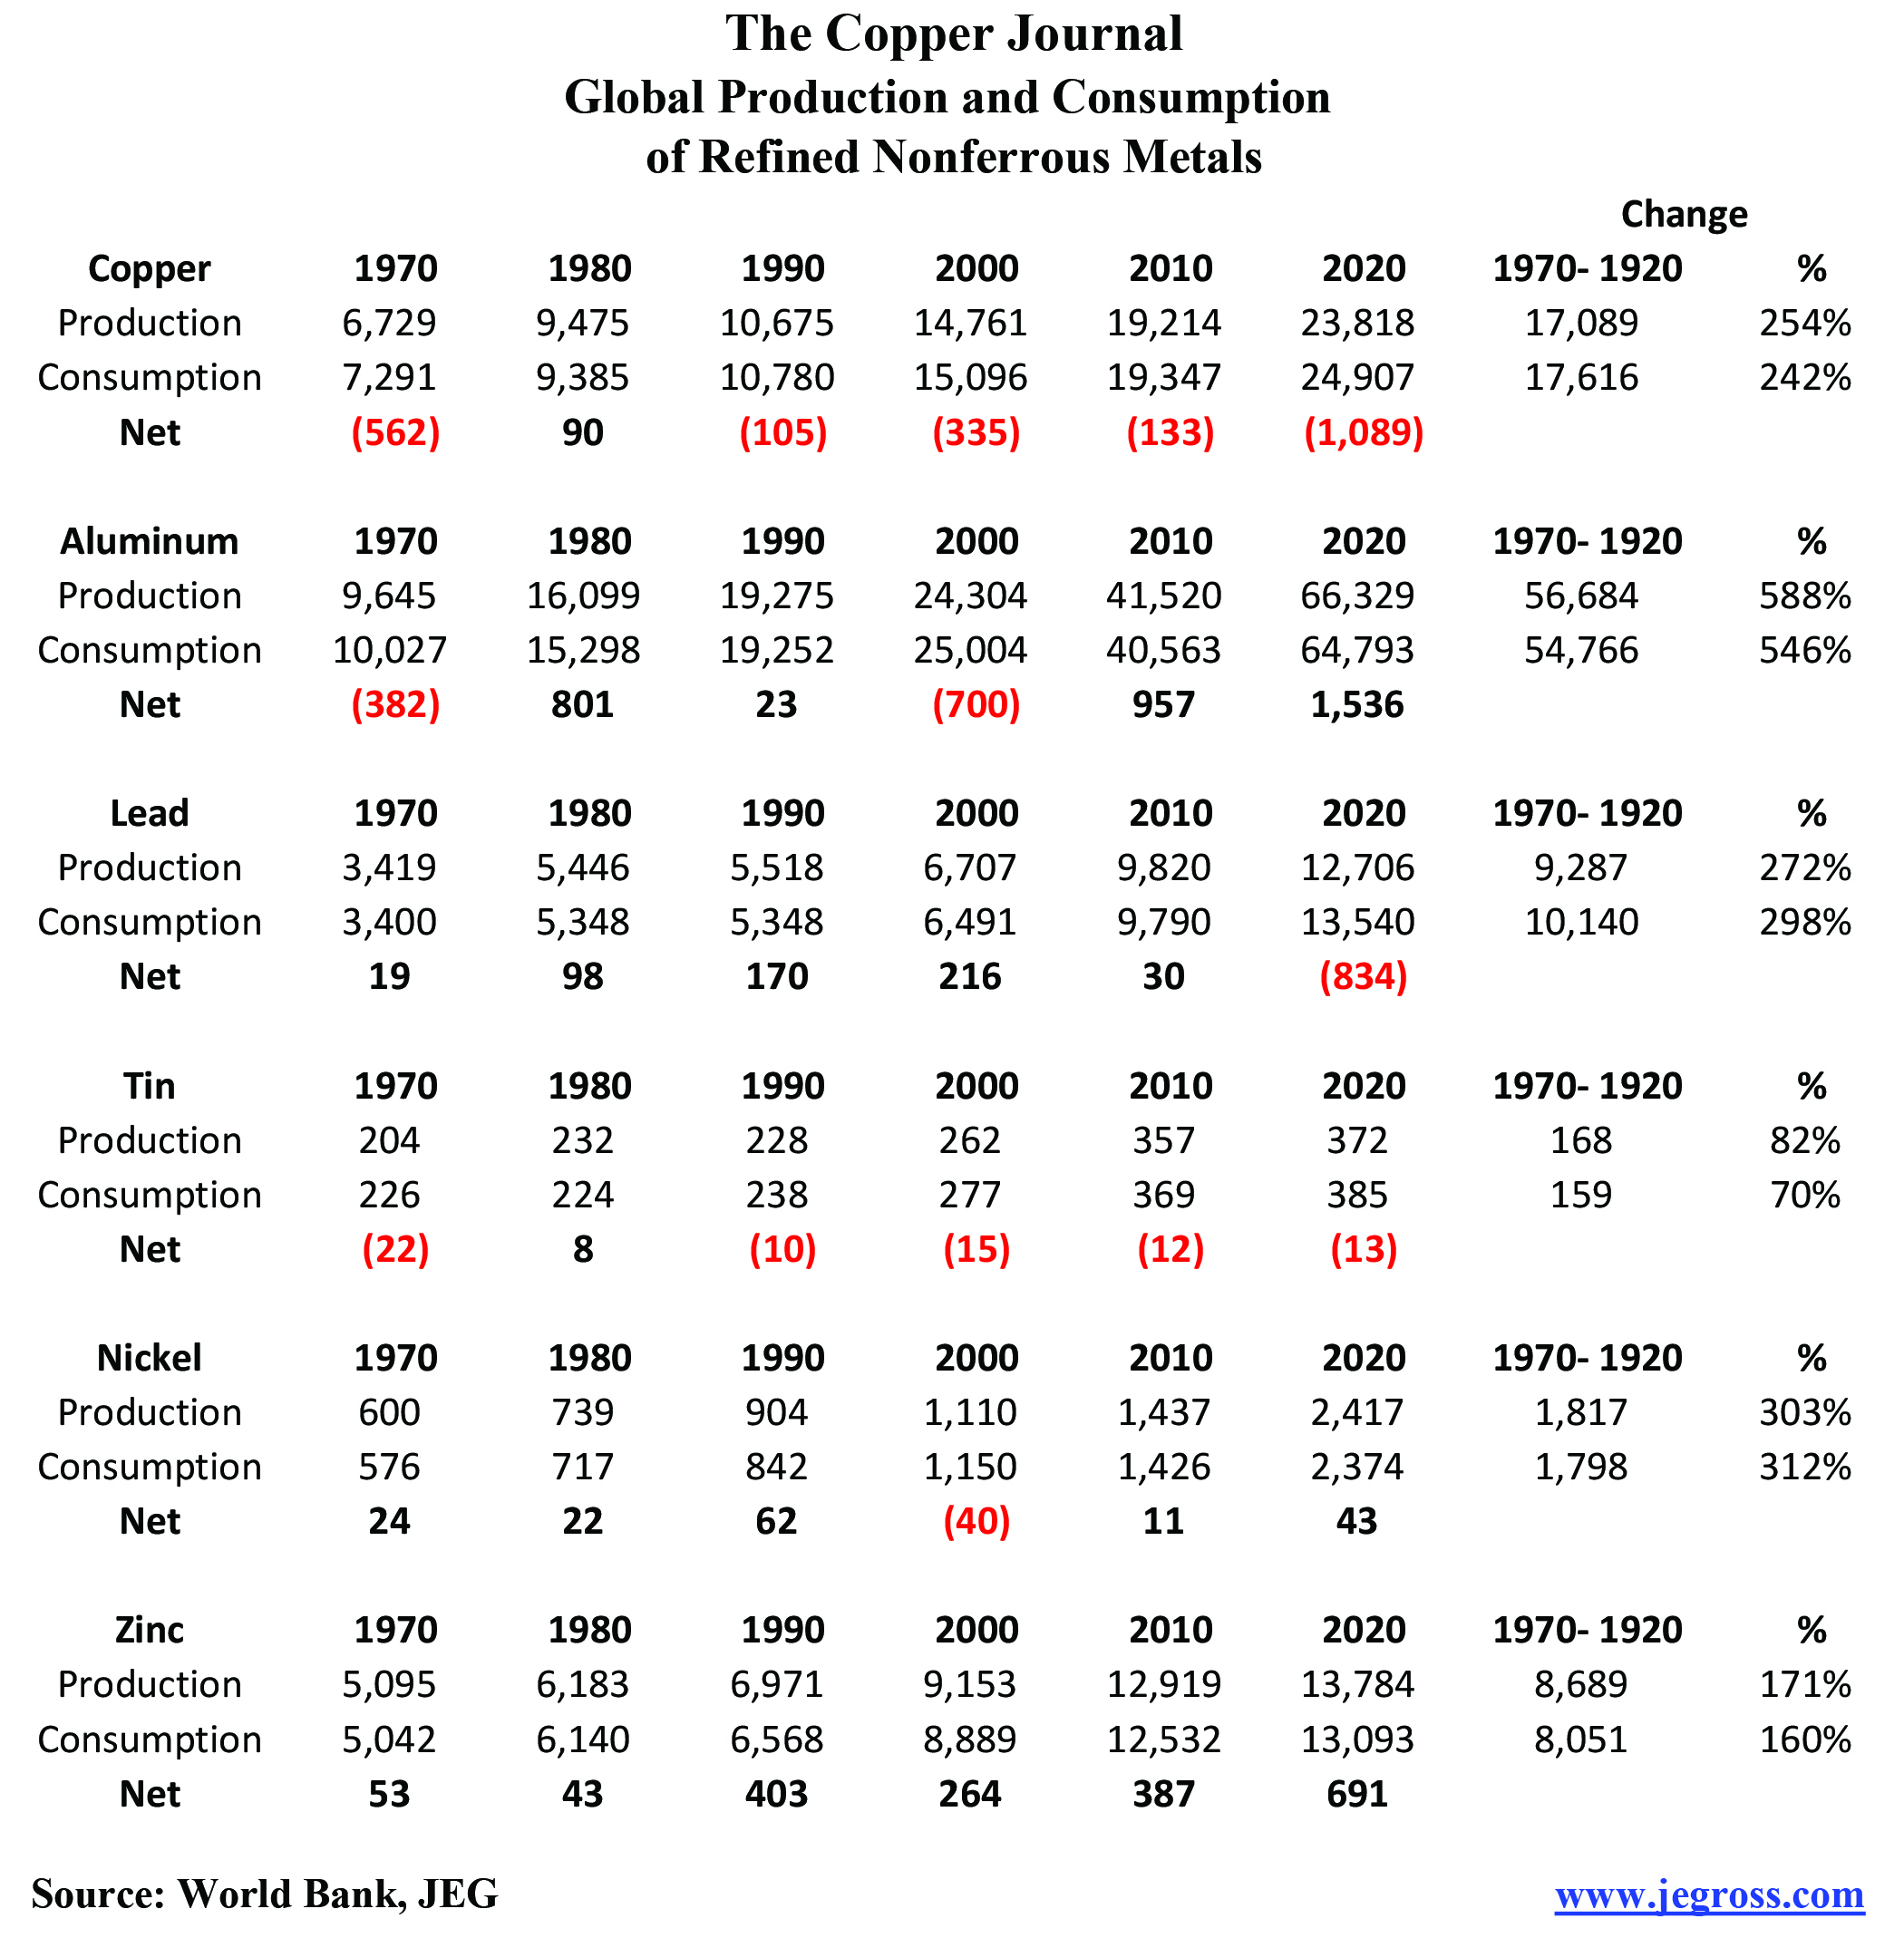
On a more macro basis, over the past 120 years, consumption of copper has risen almost in parallel with our growing population. In 1900, there were some 1.5 billion people inhabiting this earth, and global consumption of copper was about 500,000 metric tons (mt). Last year, copper usage rose to 25 million mt, and our population stood at 7.8 billion people.
Copper consumption rose not only in response to a growing population, but also as technology advanced, enabling our civilization to enjoy a higher standard of living.
Although production and consumption statistics vary for each market, the copper versus population chart is nevertheless an excellent proxy, representing the growth in other metal markets as well. A brief review of supply and demand figures for nonferrous metals by decade since 1970, tells us that both production and consumption will continue growing, but also get out of synch from time to time. This will lead to surpluses and deficits, and result in rising and falling prices — oftentimes to extreme levels, which brings us to another long-term lesson in the markets.
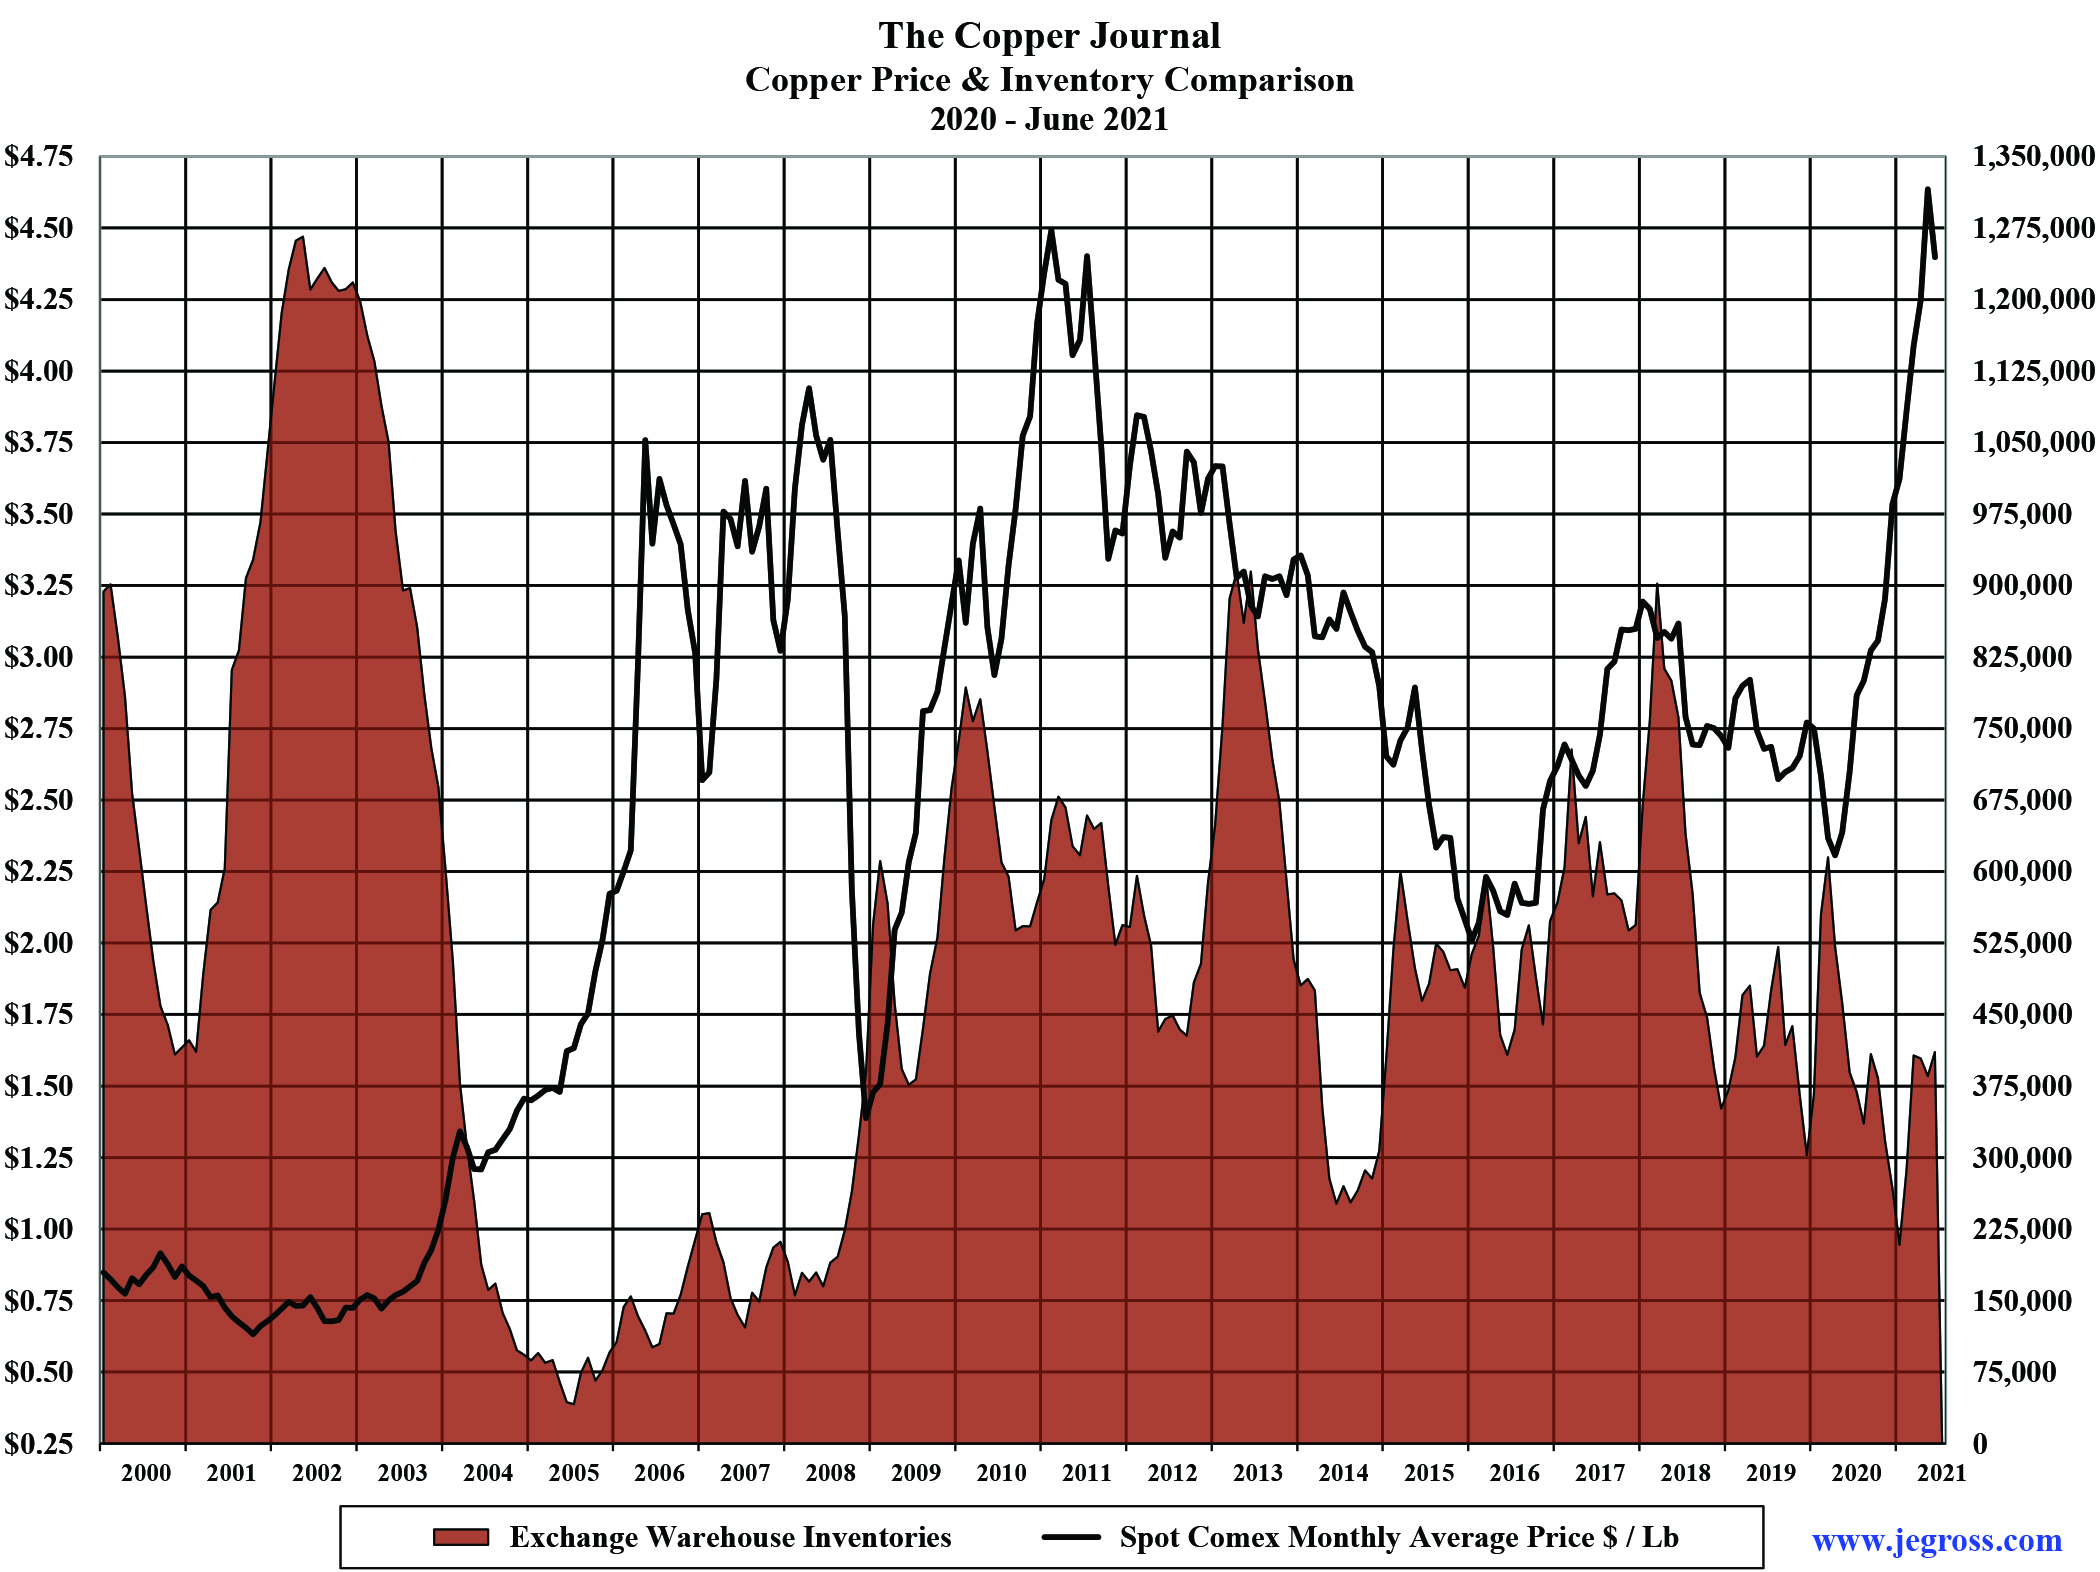
Prices align with basic economic fundamentals. When inventories are low, prices climb and vice versa.
When it comes to commodities, there is no relationship between the cost of production and the selling price, except at the extreme end of the equation. For example, Freeport McMoRan recently announced their second quarter results, and in the report, the company said the cost of producing copper in 2021 was expected to be about $1.35/lb after applying byproduct credits. Over the past 15 months, the price has been as low as $2.12/lb with a high of $4.78/lb. Thus, at these levels, it becomes a question of whether a producer makes a small profit or an enormous profit.
The mining sector has seen the other side of this coin more than a few times over the past several years. Most notably was when copper fell to $0.60/lb following the burst of the dot-com bubble in 2000, and again in 2008, when after reaching a record high $4.08/lb in July of that year, the price fell precipitously, as the global financial crisis brought all markets down, with copper falling to $1.25/lb five months later in December 2008.
Last year, prices fell sharply as the coronavirus spread throughout the world, forcing companies to shut down, lay off millions of workers, and threatening the global economy. This is similar to what was experienced in 2008, and then, as now, Central Banks around the world came to the rescue, pouring trillions of dollars into the global economy to keep the wheels of commerce turning. The financial assistance that began in 2008 enabled metal prices to not only recover, but propelled them to record highs just two years later. Today, it seems there is a repeat performance of events from 12 years ago.
Looking ahead, it is expected by many that prices will advance further as the economy continues to recover, and transitions to the “green economy.” This has the potential to push copper prices above $5/lb, because supply is not expected to keep up with growing demand. Today, declining inventories are another supporting factor.
As a point of reference, eight years ago, inventories of copper held in exchange warehouses stood at 921,000 mt. Since then, they have fallen 560,000 mt or 61% to just 361,000 mt. Aluminum inventories were 5.43 million mt in 2013, but today are just 1.42 million mt, down 4.01 million mt or 74%.
Inventories of tin held in London Metal Exchange (LME) warehouses were 14,250 mt in 2013, and have fallen 11,900 mt or 84% to just 2,350 mt most recently, representing less than one week of global consumption, and sending the price to a record high.
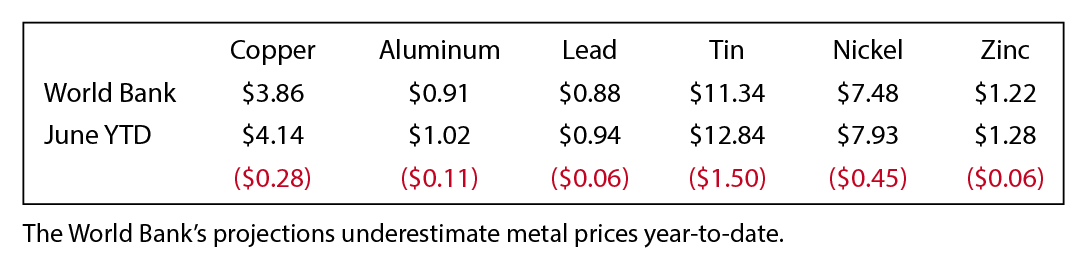
Forecasters at the World Bank have a more conservative outlook for prices in 2021, and in future years. Here is a summary of year-to-date average prices through June, as compared to the World Bank’s full year forecast (see chart below).
While it is good to have an optimistic outlook on market conditions, it’s also important to maintain a cautious approach, as past events tell us that circumstances can change on a dime.
Lack of Transparency
Roughly 20 years ago, China surpassed the United States as the world’s largest consumer of nonferrous metals and industrial materials. China now accounts for more than 50% of global consumption, so what happens there has a significant influence on markets around the world.
In 2018, they saw the detrimental impact on metal prices when the United States and China were facing a trade war. Over the past few years, China has been exerting a greater influence over Hong Kong, where the original understanding was “one country, two systems.” Now, however, China is enforcing its legal and financial structure on Hong Kong. Further, China anticipates a reunification with Taiwan at some point, and it is very uncertain how the rest of the world will react if or when that becomes a reality.
Another issue relative to China is a lack of transparency in their metal statistics. China does not report their consumption of metal, thus various statistical agencies have to make assumptions of the figure based on imports, exports and estimates of production to arrive at an “apparent usage.” Also, China holds considerable quantities of metals in strategic reserves, but the figures are a state secret.
This brings to mind the aluminum industry following the collapse of the Soviet Union in 1991.
In January 1989, the price of aluminum on the LME was $1.09/lb and inventories held in LME warehouses stood at 140,000 mt. As the Soviet Union started disintegrating, massive quantities of metal flooded western markets, causing the price of aluminum to fall drastically. By 1993, the price was down to $0.47/lb, and LME inventories soared to a record high of 2.7 million mt.
As losses mounted, the industry was in a state of shock. No one in the entire world had any idea of the enormous inventories that were hidden from the market. Ultimately, in early 1994, major producers and their governments agreed to significant production cuts to restore market balance. This became known as the “memorandum of understanding,” which in effect, was a cartel to save the aluminum industry.
 Uncontrolled Variables
There are several other critical issues that will have an important bearing on metal markets in the years ahead, thereby leading to uncertainty. And markets do not like uncertainty.
Recent floods in Europe and Asia, as well as droughts and wildfires in the United States thought to be caused by climate change, pose significant challenges to both production and consumption.
Chile and Peru are the largest and second largest producers of mined copper, representing 38% of global supply. Both countries are currently exploring increases in taxes and royalties on mining companies. Whatever the ultimate outcome is, it will undoubtedly impact metal markets and the global economy.
Major equity markets have risen sharply following the meltdown in March 2020 due to the pandemic. Since then, the S&P 500 has nearly doubled. And the higher the market goes without a correction, the greater the risk of rising volatility going forward. On July 19, the S&P 500 fell 69 points, only to climb 65 points the following day. Several instances have happened in recent years where equity markets inexplicably fell sharply, and took metal markets lower along the way.
Intensive speculative trading, along with computer-driven high frequency trading has been a major influence in metal markets for some time now, and poses an increasing threat to bigger swings in market prices. That said, markets need speculative traders to function properly. The issue becomes more serious when their influence overwhelms other market considerations.
Last year, in April, the price of WTI crude oil traded at negative $37.63 per barrel. Clearly, this was not a normal market. Along this same line, because of exchange procedures in establishing settlement prices for Comex copper, the market rose $0.30/lb on April 27 to close at $4.74/lb, but fell $0.21/lb the following day.
To state the obvious, these events do not reflect healthy market conditions, and are harmful to industry members.
On a more macro basis, the global metals industry faces significant uncertainty in changing market trends due to economic cycles, the changing value of the dollar, governmental policies, and indeed, the impact of unexpected events like the pandemic that has been here for more than a year now.
Anticipating and Responding to Major Shifts in Markets
Some time ago, we asked ourselves what might we learn if we undertook a study of the copper market to identify and isolate individual bull and bear market cycles on a daily basis over a 50-year period.
 As it turned out, after completing the project that took into account more than 12,000 closing prices back to 1970, we learned a great deal, and in fact, considerably more than we expected.
Our initial rules for the study were fairly simple to keep it consistent and meaningful.
First, the approach stipulated that the market was at all times either in a bull phase or a bear phase — one or the other.
Second, we would identify a bull phase beginning with an absolute low point in a price cycle when a declining market stopped falling, and a bear market phase starting at an absolute high point when the market rose to a new high and could not move any higher.
Third, we would only look at the spot closing prices without regard to any influencing factors such as supply and demand, inventory levels or economic trends.
Thus, we were able to establish that copper went through 10 major distinct bull and bear market cycles since 1970, and we are currently in the 11th major bull market that began in March 2020.
Typically, when one refers to bull and bear markets, they are referring to a 20% move up from a low point, or down from a high point. The result of our study found bull market moves with gains of 48%-575%, and bear market declines of 32%-70%. More importantly, what became apparent, is that once a bull market got under way, it posted a succession of higher highs and higher lows, until it was no longer able to reach a new higher level. Conversely, once the bull market ended, thereby initiating a new bear market, we see lower highs and lower lows until the market cannot fall any lower.
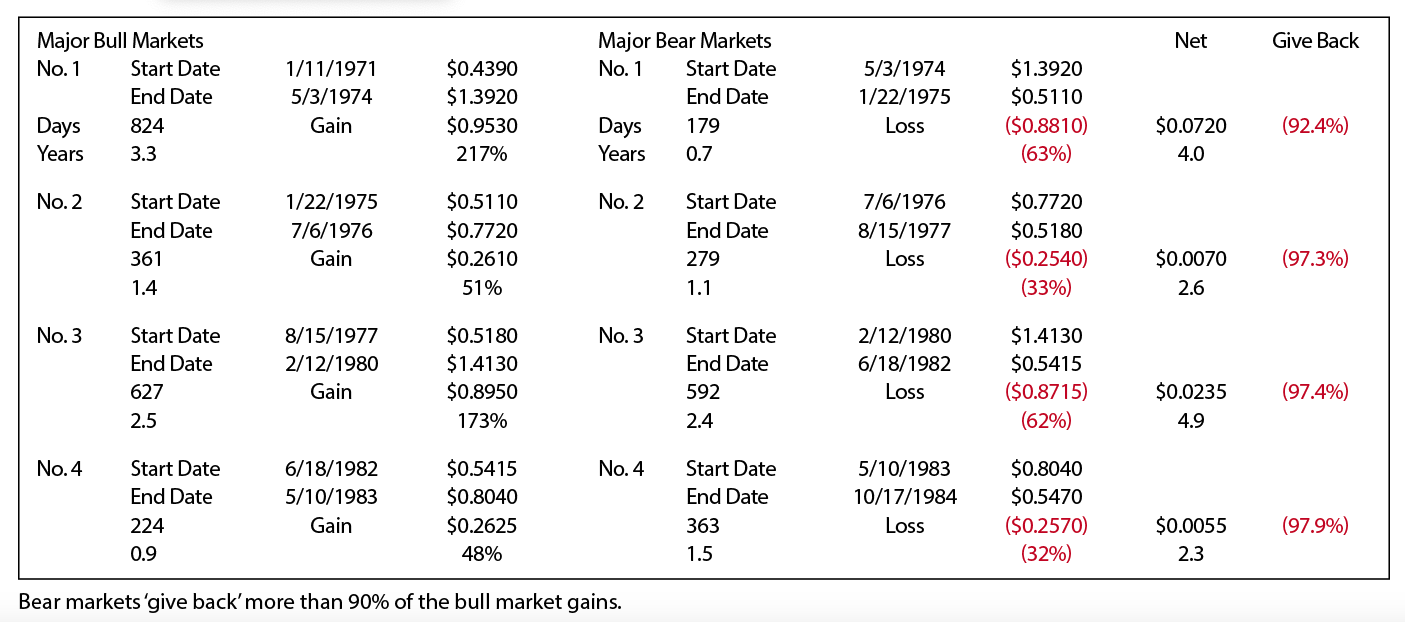
Upon completion of the analysis, we were able to summarize each market phase with the starting date and price, length of the move, ending date and price, along with the gain or loss for the entire cycle. See the partial summary of the results at the bottom of page 93.
One of the most surprising results of the study is what we termed the “Give Back.” That is to say, looking at bull market No.1, the price rose $0.95/lb. The subsequent bear market No.1 saw the price fall $0.88/lb, thus the bear market gave back 92% of the bull market gain.
If this were a one-off event, we would attribute it to happenstance. However, as you can see, the “Give Back” in subsequent markets was also substantial. And, when we examine the copper market in the aggerate, the 10 bull markets generated total gains of $12.72, while bear market losses were $11.04, for a net gain of just $1.68/lb over 50 years. Further, bull markets lasted a total of 26.7 years, and bear markets totaled 22.7 years.
 This study does not predict or forecast prices. Rather, it indicates market direction, and identifies major turning points in trends as they occur.
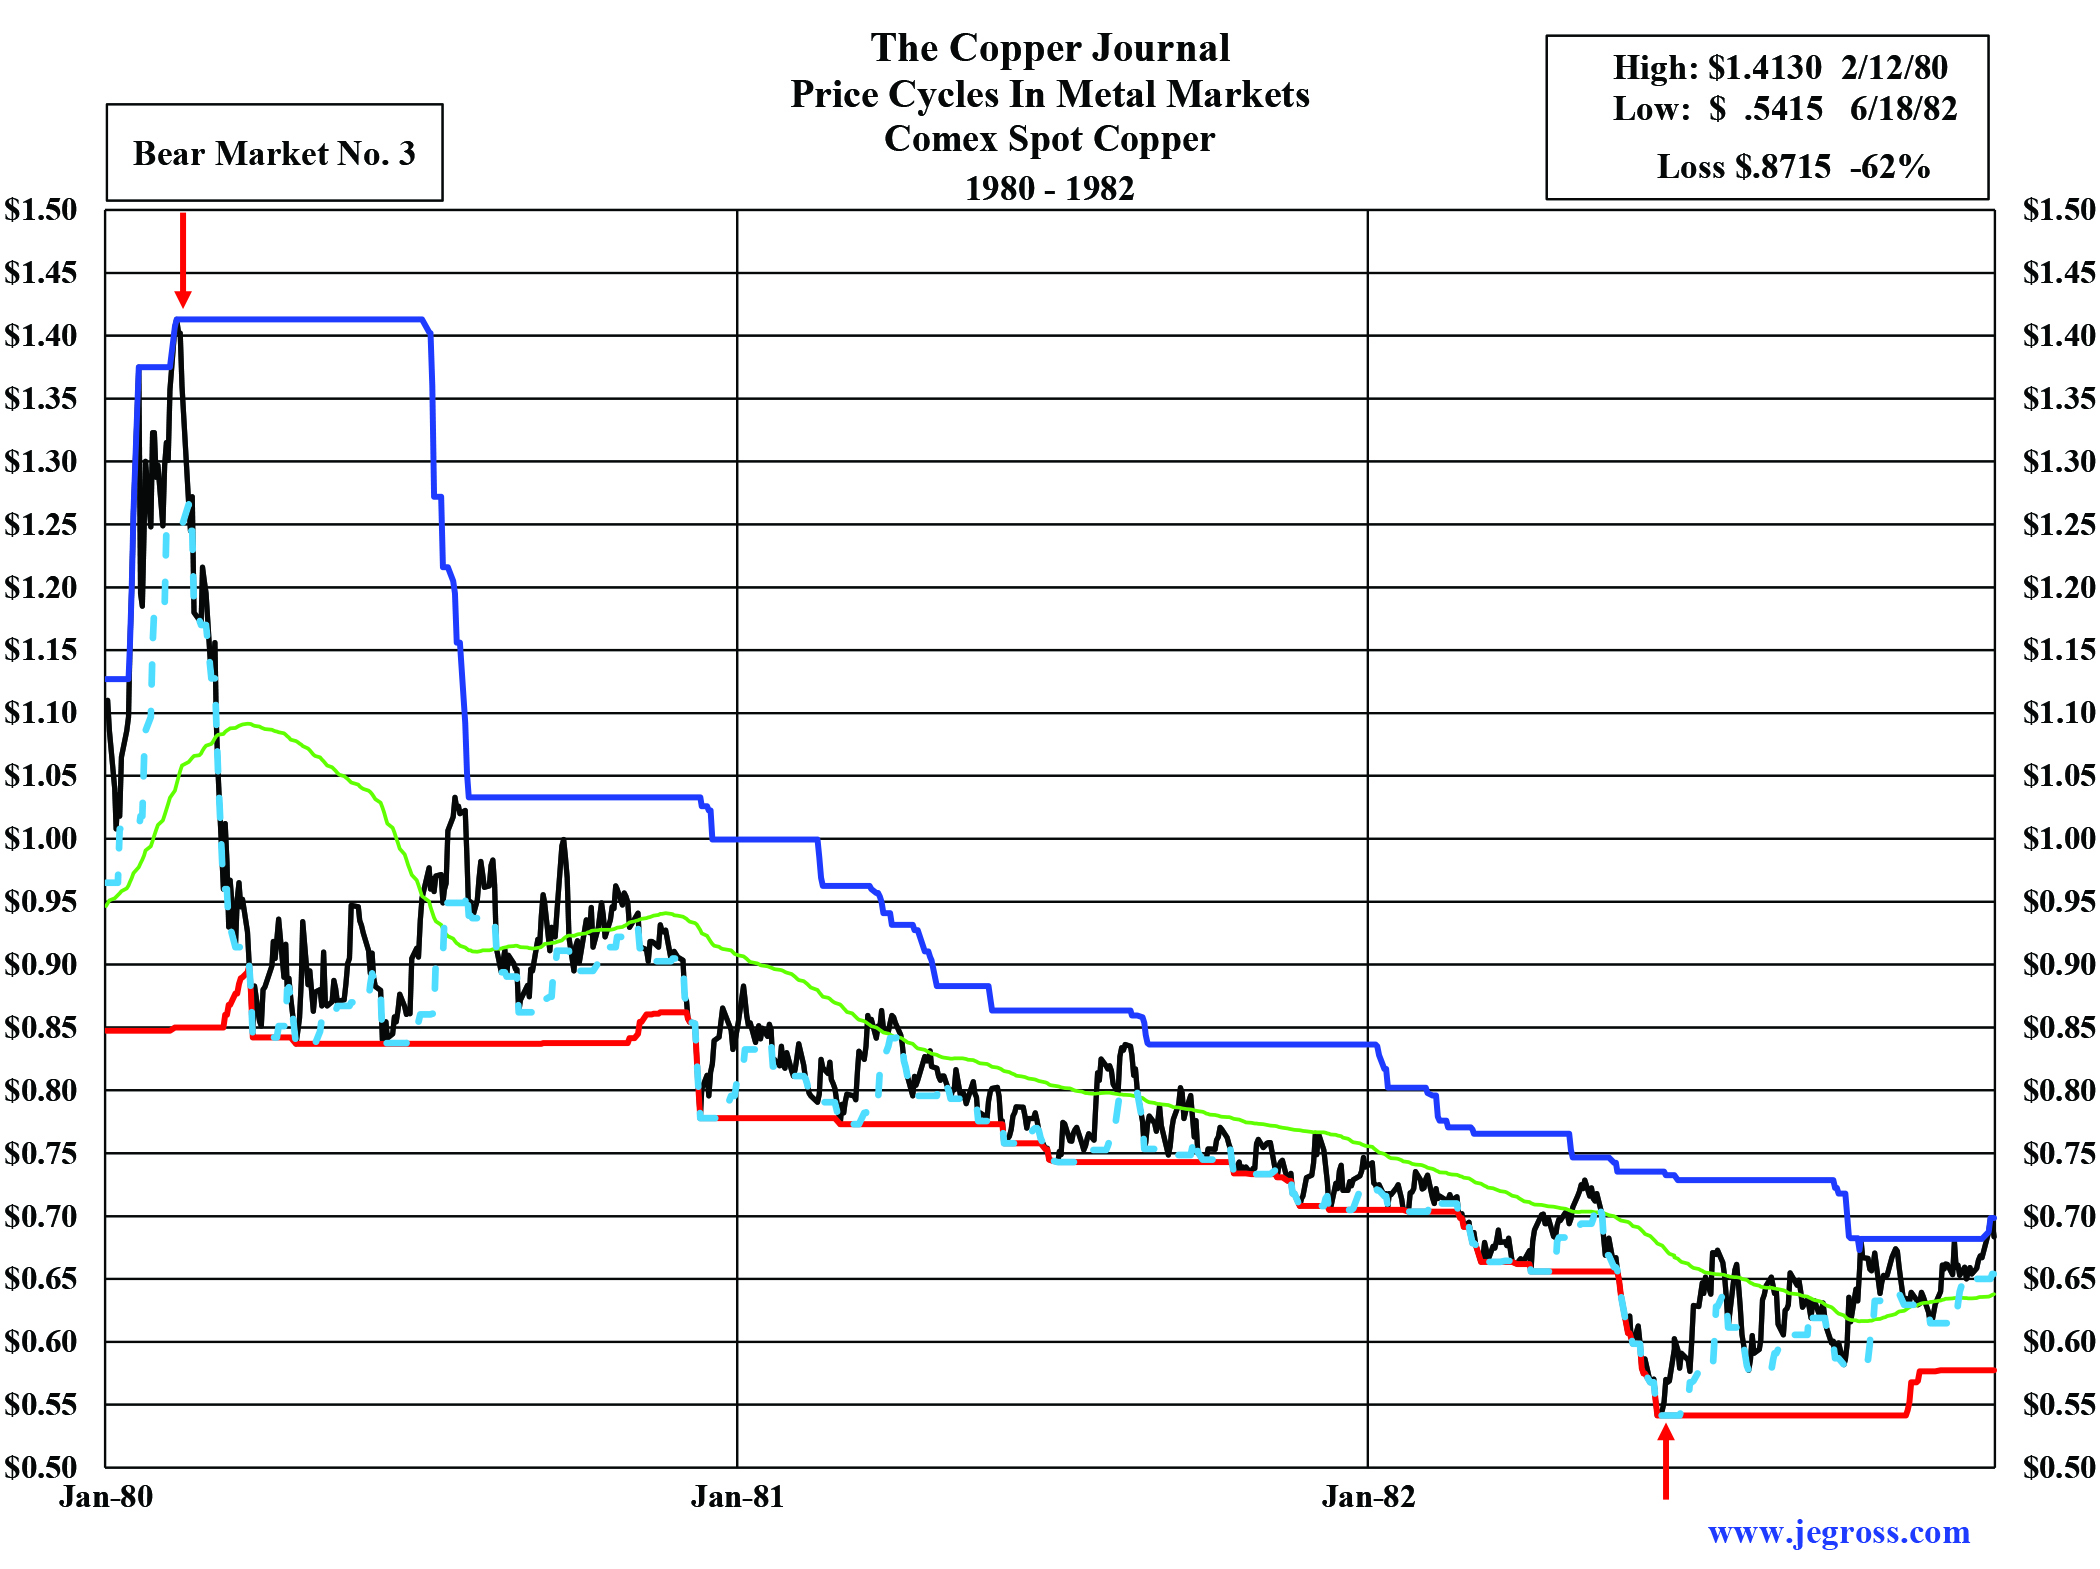
In the accompanying graph, there are examples of bull and bear market cycles. The closing price is the black line, with the red and blue lines representing approximate 20-week high and low points, with the dotted line being an approximate five-week low. And here you can also see the higher highs and higher lows in the bull markets, as well as the lower highs and lower lows in bear markets.
It should be noted that even during a rising bull market, the price will pull back along the way, but if it begins pushing the dotted line lower, it is in effect like a blinking yellow light signaling caution. And if it begins pushing the red line lower, the blinking light becomes solid yellow, alerting us that something of greater importance may be changing.
There’s also a great deal of educational value in being able to look at, and study the history of individual bull and bear market cycles to see how each one begins, evolves, and finally ends, giving us a complete picture of the sequence of events. And by inputting daily closing prices, we can monitor the trends every day. Thus, there are no surprises when markets begin changing direction.
Based on the success found in copper, the same research was conducted for the other base metals, along with silver and gold, with similar results. The entire body of work is entitled Price Cycles in Metal Markets.
Among the many findings of this study is that patterns in markets do in fact repeat, over and over again.
And the patterns repeat, because while economic cycles may ebb and flow, as does supply and demand, ultimately, markets are a reflection of human nature. And human nature, driven by emotions of hope, greed, and fear in markets, never changes.
John E. Gross is president of John E. Gross Consulting Inc., metals management
consulting firm, and is publisher of The Copper Journal, a widely read industry report established in 1987. In addition to his consulting activities.
He began his career in metals in 1973 when he joined U.S. Metals Refining Co., a division of AMAX Inc., where he rose to become manager of administration. In 1981, he joined Hudson Bay Mining and Smelting as manager of trading and precious metal sales, and in 1983, he became a futures broker with Johnson Matthey & Wallace, specializing in metals on the Comex and the LME. He is also a highly decorated Vietnam veteran.