
 The International Copper Study Group (ICSG) released preliminary data for August 2014 world copper supply and demand in its November 2014 Copper Bulletin. According to preliminary ICSG data, the refined copper market balance for the first eight months of 2014 indicated a production deficit of 544,000 metric tons (mt). This compares with a production surplus of 42,000 mt in the same period of 2013.
In the first eight months of 2014, world usage is estimated to have increased by around 12% compared with that of the same period of 2013, supported by strong apparent demand in China and a shortage of high-grade scrap that led to the use of more cathode by semiconductor manufacturers. Chinese apparent demand increased by 21% based on a 27% increase in net imports of refined copper.
Excluding China, world usage increased by 5.5%, supported mainly by apparent usage growth of 11% in the European Union (EU) and 10% in Japan, as well as by growth of 8% in other Asian countries (excluding China and Japan) and 9% in the Middle East/North African region. Usage in the United States remained flat.
World mine production is estimated to have increased by around 3% in the first eight months of 2014 compared with mine production in the same period of 2013.
World refined production is estimated to have increased by around 8% in the first eight months of 2014 compared with refined production in the same period of 2013: primary production was up 7% (including 9% growth in production from concentrates and 1.7% from SX-EW) and secondary production (from scrap) was up 10%.
Based on the average of stock estimates, Chinese bonded stocks increased by around 35,000 mt in the first eight months of 2014 from the year-end 2013 level. Stocks declined by around 380,000 mt in the same period of 2013. In the first eight months of 2014, the world refined copper balance adjusted for Chinese bonded stock changes indicated a deficit of around 510,000 mt compared to a deficit of around 340,000 mt in the same period of 2013.
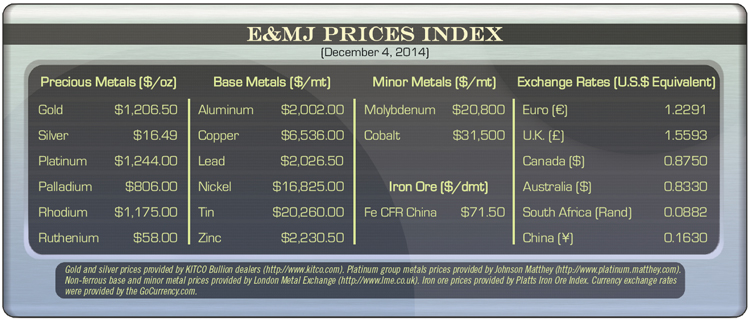
The average LME cash price for October was $6,739.20/mt, down from the September 2014 average of $6,872.23/mt. The 2014 high and low copper prices through the end of September were $7,439.50/mt (January 2) and $6,434.50/mt (March 20), respectively, and the year-to-date average was $6,920.67/mt. As of the end of October, copper stocks held at the major metal exchanges totaled 285,851 mt, a decline of 220,653 mt from stocks held at the end of December 2013. Compared with the September levels, stocks were up at LME and SHFE and down at Comex.
For more information, contact the International Copper Study Group at www.icsg.org.