


Alpha Natural Resources takes its safety program to heart, especially in the operation of preparation plants
Optimizing a preparation plant depends on a system to monitor the key performance indicators and quickly react to correct processing conditions that diminish efficiency. Alpha Natural Resources is at the leading edge in the coal industry using OSISoft Pi for remote, real-time monitoring of several prep plants.
According to Tom DeMarco in Controlling Software Projects: Management, Measurement and Estimates, “you can’t control what you don’t measure.” Monitoring key performance indicators has been a firm foundation in maintaining efficient prep plants for Alpha Natural Resources since its start. Year-to-date, month-to-date and daily reporting are common practice across every prep plant.
Alpha’s mentality of progress and improvement brought about the question of what can be done to make performance monitoring even more up-to-date than the daily reporting. With today’s typical programmable logic controller (PLC) systems, information regarding key performance indicators is readily available to the control room operator in a myriad of forms.
Some locations possess the networking capabilities to view this data from anywhere within the local operation, but what if this data could be shared across an even larger network? A previous research project included a private data collection and display system for real-time data collected from custom-installed plant process instrumentation. The value of a real-time data monitoring system was exemplified in this project.
After some browsing and research, OSISoft’s Pi software was brought to the forefront. The Pi system is a collection of software packages designed to capture, process, analyze and historicize real-time data.
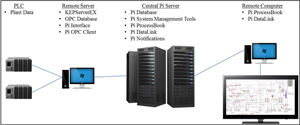 |
| Figure 1—Diagram of the Pi system and communications |
Pi, along with accompanying Object Linking and Embedding for Process Control (OPC) software, KEPServerEX, allows Microsoft Windows programs to communicate with industrial hardware devices. The combination of the software installed on the remote server located at the plant monitoring the PLC and the central Pi server allows real-time viewing and database storage of any value residing in the PLC, as depicted in Figure 1.
From this point, selected data can be manipulated in various ways as determined by the users to bring about the greatest value from the data. OSISoft has its own software environments for data to be manipulated and presented with fully customizable views determined by the user, and other familiar environments, such as Excel, can be modified to be used with the system as well. This system provides a very useful management tool that greatly enhances plant performance and efficiency evaluations.
KEPServerEX OPC SOFTWARE
One of the two prep plants chosen to test the Pi system before total deployment was Tom’s Creek prep plant in Coeburn, Virginia. Since the PLC at Tom’s Creek is an Allen-Bradley PLC, the driver suite loaded on the remote computer’s KEPServerEX software was Allen-Bradley.
The driver suites come default with every type of communications option for all of PLCs based on the manufacturer. The communications method with this particular PLC is Ethernet, so the Allen-Bradley Ethernet driver was chosen for the device driver when setting up the channel properties.
Once the channel is established in the software, the device (PLC) can be set up and communications established. Here is where the model of the PLC becomes crucial along with the IP address of the PLC. After establishing communications with the device, the PLC addresses (tags) to be monitored can be set up in the software to start reading data.
The data in the specified addresses in the PLC is pulled into KEPServerEX and converted into an OPC database. These values can also be scaled within the software if the values being pulled from the PLC are raw. A spreadsheet was developed for all of the specified addresses in the PLC and used to create a comma-delimited file (.csv) that was imported into the software.
The spreadsheet is a time saver for setting up the addresses and provides a reference document for future updates. Once the tags have been created and configured with the correct address from the PLC, the data can be viewed in real time with a built-in OPC Quick Client to ensure proper setup and configuration of the data tags.
PI INTERFACE ON REMOTE SERVER
The next piece of the communications puzzle is the interface between the remote server and the central Pi server. The Pi software comes with configuration utility software to set up and configure this interface. This piece of software essentially allows the user to create and modify the service to handle the transfer of the data from the tags written in the OPC database from KEPServerEX. The point source (remote server OPC database) is defined so the central Pi server can be configured to accept data from the specific data points listed in the central database tags.
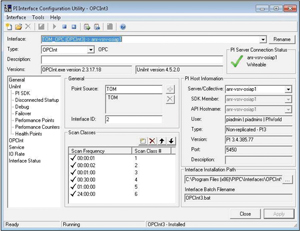 |
| Figure 2—Screenshot of general interface configuration in the Pi interface configuration utility software. |
Figure 2 shows the general interface configuration options with the server descriptions and point source identifiers.
Another important piece of the interface is the buffer service. This service allows the data from the OPC database to be stored locally if communications with the central Pi server are lost. The data will continue through the OPC database until communications are restored. The data is then processed through the queue and sent to the central server until the current data is transmitted. Normal transfer operations will begin at this point.
PI OPC CLIENT
Once the tags have been created in KEPServerEX, the Pi OPC client software can be used to ensure that the Pi system can access the OPC database and read the values from the tags created in KEPServerEX (Figure 3).
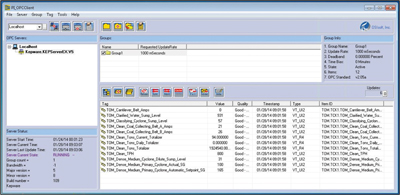 |
| Figure 3—Screenshot of tag values in the Pi OPC client software. |
The Pi OPC Client software allows the user to navigate through the devices, in these case, the PLCs, select individual or multiple tags, and add them to a customized group for viewing. After data access is confirmed, the customized group of selected tags can be saved as a comma-delimited file, which makes creating tags in the Pi system on the central server much quicker and more efficient since all tags can be imported at once.
THE CENTRAL PI SERVER
The central Pi server consists of a virtual server running Windows Server 2008 R2 Standard connected to the company’s internal network via Ethernet. Configuration of the server and Pi software installed on the server can be performed remotely from anywhere within the company’s internal network.
REMOTE SERVER TRUST
Before anything can be pulled into the Pi system from the remote server, Pi has to give permission to the remote server’s interface for data transfer. The Pi System Management Tools (SMT) software allows the trust to be created based on both the IP address and network path based on the computer name of the remote server (Figure 4).
| Figure 4—Screenshot of trusts in Pi System Management Tools |
Setting the system up in this manner allows the remote server to communicate with the central Pi server regardless of any networking issues on either of those methods. A static IP address was also given to the remote server to prevent any issues with IP address changes if the computer was restarted for a power loss. This also allows the trust to be applied to the static IP address.
TAG IMPORT USING PI SMT EXCEL ADD-IN
Tags can now be created in the Pi database based on the tags that were created and exported using the Pi OPC client software. The tags can also be individually created and configured using the Pi SMT software, but this is extremely tedious and time-consuming.
OSISoft provides an add-in for Excel that allows the importing of all of the tags at one time. The different fields for configuration are available for editing in Excel for convenience of mass editing. The tags can also be exported into Excel using the add-in for data backup purposes.
PERFORMANCE EQUATIONS
Tags are important pieces of data that can provide numerous opportunities for efficiency improvements, but when the tags can be combined in mathematical computations their effectiveness is increased. Pi accomplishes this with special types of tags designated as performance equations.
The equations can be mathematical, logical or a combination. Plant yield is a very common calculation performed in the PLC and transmitted to the HMI (human–machine interface), but what if this isn’t an address that is easily known or unavailable for transfer into the Pi system? The individual tags could be included in a performance equation in Pi.
DISPLAYING THE DATA
Now that the tags are reading data in the central Pi server from the PLC through the remote server, the values need to be presented in a manner that maximizes understanding of the variable the values represent. Pi ProcessBook is software used to build graphic user interfaces for HMI applications.
OSISoft also offers an add-in for Excel called Pi DataLink, which provides a text-based interface along with data manipulation of current and archived values stored in the Pi tag database. The values of the tags can also be used to trigger events and notifications to be broadcast based on limits or on a scheduled basis using Pi Notifications.
PI PROCESSBOOK
The current HMI design at Tom’s Creek is limited since the hardware has restricted processor availability for the size of the processes it currently runs. ProcessBook provides the functionality of custom-built graphic user interfaces without interfering with the critical processing needed for the plant control through the HMI and PLC.
It is controlled using two small Allen-Bradley PanelViews measuring 9.5 in. wide by 7.25 in. high. Even if the processor availability allowed for more graphics to be added, the physical screen size would still limit the presentation.
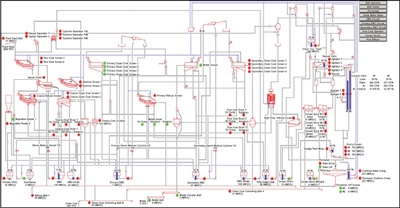 |
| Figure 5—ProcessBook interface for real-time flowsheet monitoring |
Using ProcessBook, screens were created based on recommendations given by the control room operators and plant personnel. The screens are used as monitoring interfaces only and provide information not currently easily obtained through the HMI.
A computer and large widescreen HDTV were installed to run ProcessBook and display the custom graphic user interfaces. Just a few examples of ProcessBook interface options include current material flows shown using text, vessel levels displayed using bar graphs to show percent full, multistate symbols used to represent operating status of equipment and trend charts showing real-time and archived values of any tag in the system (Figure 5 and Figure 6).
ProcessBook is a valuable tool that can increase the understanding of process variables and plant control in numerous ways, as determined by the need of the system, and the design of the graphic user interfaces.
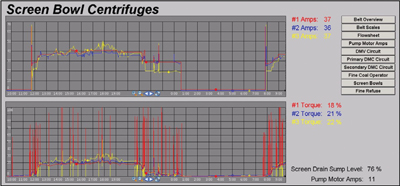 |
| Figure 6—ProcessBook interface for real-time screen bowl centrifuges monitoring and trending Pi DataLink. |
Figure 5 also shows how easily a background image is imported into ProcessBook and used along with the built-in objects for graphical displays. A picture version of the plant flowsheet was imported. The objects were then placed on top of the image to represent the individual process variables.
Both real-time and archived data can be accessed and manipulated just as if it were a number given on a regularly scheduled report, as shown in Figure 7. Trending is also available through DataLink for real-time and archived values.
This provides crucial data for plant efficiency reporting immediately and also reduces the number of times a value is replicated across a reporting system, thus reducing error in replication of said value across the various mediums.
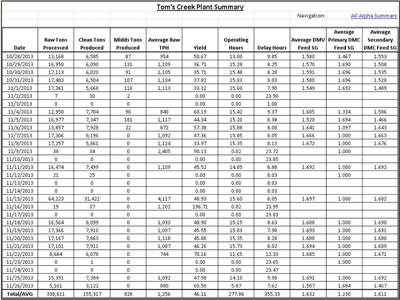 |
| Figure 7—Monthly summary report with DataLink add-in for Microsoft Excel. |
Not all crucial plant control variables are available in the PLC. Some examples would be feed blend, reasons for downtime, flotation chemical dosages, thickener chemical dosages, etc.
DataLink also has the functionality of writing to the archive stored in the central Pi server through use of Visual Basic for Applications-coding. The desired values can be written to specific tags determined by the user.
The program also provides a result field indicating the verification of the value written along with a field read-back from the database for the indicated tag showing the value of the tag in the database. This allows user input variables to use in the Pi system, increasing system value in efficiency monitoring.
PI NOTIFICATIONS
Notifications and alerts can be configured and deployed to users based on value limits and/or a scheduled basis using Pi Notifications. They can be broadcast with various communications methods, but emails were chosen in this particular system using the company email system considering the availability and reliability of the system.
An event-based alert could issue an email if the plant feed rate drops below a certain low limit for a specified period of time, or the vessel level of a critical chemical drops below the point to refill limit. A scheduled notification could also be emailed to a number of personnel with daily average and totalized key performance indicators.
CONCLUSIONS
OSISoft Pi has provided the mineral processing engineer a very powerful system that can be used to develop an intricate key performance monitoring and manipulation system. Once initial setup is complete, the system is simple and straightforward to customize to adapt to user’s needs.
The project to develop the system for the Tom’s Creek preparation plant was primarily initiated to demonstrate both the major benefits of the new system along with how existing system shortcomings can be overcome with the additional functionality for plant performance evaluation.
Although up-front time to set up the Pi system and achieve constant, reliable communications between all pieces may take what appears to be a large amount of time, the system can provide crucial process control points in real time for efficiency evaluations and improvements.
Alpha Natural Resources is committed to expanding the Pi system to include all the preparation plants in order to have a company-wide system that provides accurate, reliable data for reporting and evaluation without the delay of normal reporting procedures. This work will include developing unique and proprietary systems based on the needs and standards for each operation.
Coby Addison, Van Davis, Frank Addison and Jeff Walkup manage Alpha Natural Resources’ fleet of prep plants. This article was adapted from a presentation they gave at Coal Prep 2014, which took place during May in Lexington, Kentucky, USA. For more information about Coal Prep or to see the original paper, visit: www.coalprepshow.com.


