


Last year was better than the year before and 2017 might be even better yet
By Joseph F. Govreau

The new year brings with it the promise of new beginnings and 2017 may very well end up being the new beginning the mining industry has been waiting for. After hitting five-year lows in capital expenditures, leading indicators for mine development, including commodity prices, have improved substantially; but will the improvements in commodity prices that were experienced in 2016 carry into 2017? The answer to that question will be one of the key drivers expected to impact capital spending for the mining industry in 2017.
Uncertainty is constant. War continues in the Middle East and a new U.S. leadership takes control January 20. Initial comments from mining companies and associations have been positive toward the new executive team that President-elect Donald Trump is putting together. Trump has said he will help the beleaguered coal and steel industries, and appears to be pro-mining, but talk is cheap and action is what the industry needs. Only time will tell if the new executive leadership can set a framework where mining and metals companies can thrive in the U.S. The administration can help by promoting a revamp of the mine permitting process and installing policy that will help, not hinder, mining. But even this will not guarantee further recovery of mining in the U.S. Market drivers, mainly commodity demand and prices, will dictate how mining companies spend money in 2017.
For the most part, 2016 was a considerably better year for mining companies than 2015. Even though capital spending reached its lowest point in five years, leading indicators of project spending, like commodity prices, improved. Coal, gold, iron ore and zinc were a few of the commodities that experienced price increases in 2016. Demand for rare earths and lithium for use in batteries and other electronics is driving an increase in exploration-stage projects for these commodities. If metal prices continue the upward trend, then the mining industry will respond with more projects.
Mining companies have gone through several years of production and capital spending cuts, for the most part postponing large projects, especially grassroot mines, in favor of smaller in-plant capital and productivity optimization projects. There are some notable exceptions like Rio Tinto’s $5.3 billion expansion of the Oyu Tolgoi mine in Mongolia. This trend will continue in 2017, but companies are starting to benefit from the conservative policies of the past few years and have better balance sheets as a result. We’ll see an increase in the development of larger projects in 2017 and 2018. Industrial Info is forecasting a slightly higher capital spending outlook for 2017 than 2016 as continued moderate growth combines with the need for companies to make equipment improvements and replacements that have been delayed.
Grassroot mine project spending, which reached the lowest point in 2016 since the peak of the mining boom, will see some improvement in 2017-2018 as companies will need to replace capacity coming offline.
North America continues to be the No. 1 region for mining project development, with more than $403 billion worth of projects, ranging from exploration stage to construction. (See Global Mining Project Development Map Graphic) More than 80% of the value of active mining projects in North America is located in Canada.
The improved commodity prices in 2016 have the market buzzing with activity, even though that activity has not yet translated to an increase in equipment and construction service orders. Over the past year, there has been a significant increase in the value of projects in the advanced planning and permitting stage. This has engineering consultants busy evaluating mines or reevaluating older projects that were put on the shelf when the market slowed. Data from Industrial Info’s Mining Market Business Intelligence Platform shows that the value of mining projects in the scoping/feasibility study stage declined from $502 billion to $311 billion, but projects in the advanced planning stage increased from $403 billion to $627 billion. The overall value of active mining projects in the pre-approval stages (exploration, feasibility and permitting) stayed about the same in 2016.
The trend of declining value of projects under construction continued in 2016, marking the fourth year in a row for declining construction. Mining projects under construction declined from $258 billion in 2015 to $219 billion in 2016. This is mainly due to declines in China, Russia and Latin America. However, even though the overall number is down, some parts of the world are experiencing increasing mining construction activity, including south Asia (India), which increased from $7.3 billion to $7.8 billion; southeast Asia, which increased from $11.4 billion to $13 billion; and Turkey/Stans, which increased from $4.8 billion to $6.1 billion. We expect this trend to continue in 2017.
The top 10 countries for mining project development are Canada, China, Australia, India, the USA, Brazil, Russia, Chile, Peru and South Africa (See Top 10 Countries for Mining Project Development Chart). African nations, including Botswana, Congo, Guinea, Mozambique, Namibia and Tanzania, have become investment destinations for resource-hungry Asian nations, including China, India and Saudi Arabia. More than 200 mining projects are being developed in these six emerging African nations, representing $62.4 billion.

Iron Ore
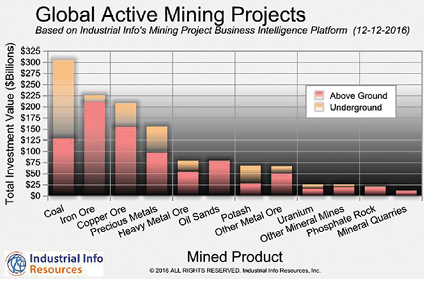
With an investment of $225 billion, iron ore is the second largest commodity for project development behind coal. Iron ore prices doubled in 2016 after bottoming out in 2015. This surprised analysts as stockpiles remain high and new capacity continues to come online from large projects being built by companies like Rio Tinto, Vale SA and Roy Hill. Kicking off 2017, Vale SA is starting operation of the massive $14.3 billion Serra Sul S11D mine in Brazil. Construction began on the project in 2013. The mine’s three production lines will be able to process 90 million metric tons of iron ore per year (mt/y).
Canada is the country with the largest value of iron ore projects worldwide, with more than $47 billion planned. Brazil, Australia, India, Guinea, Russia, China, Congo, Sweden and Peru round out the top 10 countries for iron ore project development.
Copper
Codelco, the world’s largest copper producer, announced it would increase capex in 2017 to $3.8 billion, up from $3 billion in 2016. The company is focusing on expansion of the Chuquicamata mine in Chile and has several projects in the works, including a new effluent water treatment plant for the copper smelter.
China consumes about half of the world’s metals, including copper, and the nation continues to have a huge impact on global markets and subsequently capital expenditures. It’s expected that China’s investment in the construction industry will increase demand for copper over the next few years, and if this happens, capital spending is expected to increase. Companies like Rio Tinto are planning and building new mines like Oyu Tolgoi in Mongolia, betting on increased copper demand and an expected supply deficit toward 2020.
Gold
The price of gold increased by about 20% in 2016. Mining companies continue to invest in new mines and expansions to replace depleting reserves. For example, Newmont Mining Corp. has completed construction and started operation at the Long Canyon open-pit gold mine located near Wells, Nevada. The $225 million project was completed early and under budget and represents one of the lowest cost mines in the Newmont stable, with all-in sustaining costs estimated to average between $500 and $600 per ounce (oz). The mine is expected to produce between 100,000 oz and 150,000 oz per year for eight years. A second-phase expansion of Long Canyon mine is being studied to extend the mine life. Newmont Mining is developing a continuing portfolio of mining projects ranging from early stage exploration projects to projects under construction. Also in 2016, Newmont began operation of the Merian gold mine in Suriname. Industrial Info is monitoring more than $10 billion worth of mining projects for Newmont Mining worldwide as part of its Mining Market Business Intelligence Platform.
Zinc
Zinc prices reached a nine-year high on the London Metal Exchange in December due to speculation, but also improving conditions in China, which have buoyed demand for metals. The industry has shut several zinc mines in recent years and that has had some impact on prices. In Glencore’s third-quarter production report, it noted zinc production of 789,200 mt, which was down 30% on the comparable period, reflecting the volume reductions that were implemented mainly in Australia and Peru.
Glencore recently placed the Black Star mine and Lady Loretta zinc-lead ore mines in Australia on care and maintenance, taking 2.3 million and 1.3 million t/y of ore out of the market, respectively. Also in Australia, MMG Ltd. closed the 5.2-million-t/y Century mine. In Ireland, Vedanta Resources PLC closed its Lisheen zinc mine, which produced 2.8 million t/y. Since the beginning of 2015, 18 lead-zinc ore mines have started operation. Fifteen of those were small producing mines in China. One mine started up in Canada and two in Spain. Trevali Mining Corp. (Vancouver, British Columbia) restarted the Caribou mine in Bathurst, New Brunswick. In Spain, Minas de Aguas Tenidas SAU, a joint venture between Mubadala and Trafigura, has restarted the Sotiel mine, and the new mine in Huelva Cueva de la Mora, which produces copper and zinc ore.
The strong zinc market has miners reevaluating projects to bring supply online. Globally, Industrial Info is tracking more than 175 zinc-ore mining projects totaling about $16.5 billion as part of the Global Mining Business Intelligence Platform.
Twenty-six zinc mining projects totaling $3 billion are under construction. This includes a $172 million project by Gansu Changba Nonferrous Metals Co. Ltd. to expand an underground zinc-lead mine in Longnan, China. The project is expected to increase mine capacity up to 3 million t/y by late 2018. Projects are also under construction in Australia, India, Indonesia, Ireland, Kazakhstan, Peru and South Africa.
New Technology Will Drive Demand for Metals
Energy efficiency will be an important driver of capital spending in 2017 as companies continue to look for ways to reduce operational cost. The expansion in microgrid development, as well as the use of electricity, batteries and fuel cells at mining operations, will continue. To reduce the use of diesel fuel in mining operations, companies are investing in retrofitting equipment fleets with electricity, batteries or fuel cells. With demand for batteries and fuel cells going up, demand for lithium and platinum, which are used in these products, is also rising and driving project development.
All in all, 2016 is looking more like a turnaround year for the mining industry. Capital expenditures are expected to improve moderately in step with commodity prices in 2017.
Joseph Govreau is vice president of research for the metals & minerals industry for Industrial Info Resources, located in Sugar Land, Texas.
Pinching the Project Pipeline
A quick scan of 2H 2016 mining industry financial reports, presentations and conference-call transcripts provides a relatively clear idea of how metal producers are handling the management of their project pipelines. Unsurprisingly, their current focus is mostly on cost-effective completion of brownfield projects, with promising greenfield projects receiving attention but advancing under a yellow caution flag.
A case in point: During Southern Copper Corp.’s (SCC) third-quarter 2016 earnings call in October, company executives were quite willing to discuss the potential value of greenfield projects such as the proposed Tia Maria mine in Peru, development of the El Arco copper-gold deposit in Mexico and the Los Chancas copper-moly deposit in Peru, but repeatedly qualified their comments to ensure there was no misinterpretation—investment in these prospects will proceed carefully and in step with market trends. As SCC EVP Daniel Muñiz explained when asked about the company’s strategy vis-à-vis brownfield vs. greenfield development: “[Our mindset] is to be very conservative, looking at IRRs, looking at risk/reward and pushing the gas on the better ones, so to speak.” However, some prospects are harder to categorize than others. As an example, he cited the company’s El Pilar property as a greenfield project that could also be regarded as brownfield, explaining that its location within 40 km of the company’s existing Buenavista operation could qualify it as a logical expansion of the new SX-EW plant at Buenavista—and at a bargain, noting that SCC acquired it in 2015 for $100 million and believes it could yield 30,000 tons of copper per year.
Meanwhile, Vale, the world’s largest iron ore producer, is looking at revising its fundamental concepts for mine planning and design in order to reduce the number of future projects needed to maintain its production goals, as well as to reduce future capital investment requirements. In a late-2016 investor presentation in New York City, Peter Poppinga, chief executive of Vale’s Ferrous Minerals business, explained how the company plans to change its future mine-plan template from a conventional sequence involving mining → crushing → screening → milling → concentration → saleable product, to a simpler plan that would encompass only mining → crushing → screening, culminating in an “intermediate product” that would then be shipped from Brazil to a point closer to the end customer for further processing into the required saleable product.
This move to offshore blending, said Poppinga, would eliminate the need for each of Vale’s three mine groups, or systems—Northern, Southern and Southeastern—to produce its own final, saleable product. Along with Vale’s push to increase the proportion of dry processing used in its ore preparation, it is expected to substantially reduce its need for new projects to maintain a production level of 450 million mt/y until 2030, along with an associated drastic drop in long-term capex.


