


By Magnus Ericsson, Anton Löf and Olle Östensson
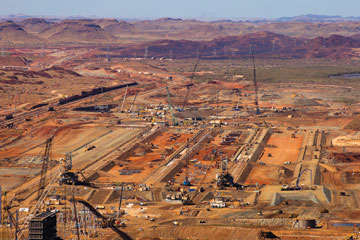 In October, Rio Tinto celebrated completion of the first phase of the major expansion of its integrated iron ore operations in the Pilbara. It is evaluating a number of options for further mine capacity growth there.
In Europe, production fell by 2.7% due to shrinking industrial output. Steel production in Africa decreased by 2.9%, continuing its decline from 2011, mainly due to power shortages in South Africa. In the Americas, production grew by 0.9%, but was still below the level reached in 2008, before the financial crisis. Many major producers experienced declines in crude steel production, including Brazil (-1.5%), Germany (-3.7%), Italy (-5.2%), Japan (-0.3%) and Ukraine (-6.9%). Countries that experienced increases included India (4.3%), Republic of Korea (1.2%), Russia (2.5%) and the United States (2.5%).
The recovery in crude steel production since the financial crisis has been almost entirely due to China, where production started increasing again in November 2008 and previous peaks in monthly production were matched in April 2009. In April 2013, the rest of the world was still far from reaching pre-crisis production rates. Growth rates in most of the OECD area are likely to be very modest over the next few years.
The slowdown in global economic growth in 2012 meant that steel demand also suffered, increasing by only 2.9%. Steel demand in China increased modestly, by 3.5%, compared with the impressive increases in previous years. Steel demand growth recovered in the autumn of last year, however, and was relatively strong in the first months of 2013. Steel use in the rest of the world outside China grew by 2.4% in 2012.
Iron Ore Production
The world iron ore market stopped growing in 2012 and production declined marginally (by 1.8%) to 1,863 million mt. With the exception of the financial crisis in 2009, this was the first year of decline since 2001.
Output grew in Australia by 8.9%, while in most other countries output decreased or remained static. Among the major producers, Brazilian, Chinese and Indian production fell by 7.6%, 12.7% and 8.7%, respectively. Russian, Ukrainian and South African production increased marginally.
Australia has taken the lead globally and has become the dominating force in iron ore production. Australian production is 150 million mt larger than that of Brazil. Brazilian expansion of production also is slower, and Australia will continue as the top producer for several years. In India, which has large and good quality resources of iron ore, production will be held back by difficulties in achieving compliance with regulations, as well as controversies over land use and the sharing of production between domestic use and exports. Over time, as the Indian steel industry grows, most of its iron ore will be used domestically. The slow decline of Chinese production, down by 41 million mt, as forecasted previously, continues. Estimates of Chinese production were made based on a careful analysis of pig iron production in China and iron ore import statistics. These figures are considered to be more reliable than the Chinese gross production figures, which do not consider the grade or the iron content of the ore produced. If prices fall, it will decline more rapidly and a “Great Chinese shake-out” could take place.
Worldwide, pellet production stabilized in 2012 and rose by 0.8% in 2012, from 421 million mt in 2011 to 424 million mt, reaching yet another record level. This reflects a continued increase in demand for pellets in many countries, although the weakness of the steel market has led to reduced growth in pellet demand relative to the total iron ore demand.
Ore Exports Reached Record Level
In 2012, international iron ore trade reached a record level as exports increased for the 11th year in a row to reach 1,131.7 million mt, up 0.8% compared with 2011. The increase was the result of higher demand almost entirely from China, while most other countries, except Korea and Taiwan, had trade levels similar to the year before or lower, and have not yet reached their import levels of 2008.
Australia’s exports increased 7.4% to 471.1 million mt in 2012, compared with 2011. Brazilian exports fell by 6.3% to 326.5 million mt. Exports from India fell for the third consecutive year. Until 2010, Indian exports had grown for 12 consecutive years, but export levels headed downward in 2011 and the country lost its high ranking among world exporters, dropping from third to sixth.
In 2012, China imported 745.4 million mt, an increase of 8.5% compared with 2011 and accounting for 64% of total world imports. In Japan, iron ore imports grew by 3% to 132 million mt. In the Republic of Korea, imports increased by 1.7% to 66 million mt. European imports (excluding the CIS countries), fell 9.1% in 2012 to 121.6 million mt, representing slightly more than 10.4% of world imports.
The seaborne iron ore trade increased by 4.8% in 2012, to 1,110 million mt. As in 2011, the increase was entirely due to growing Chinese imports, with trade in other regions declining.
Price Trend is Down
Iron ore prices trended downward during most of 2012, responding to a slowdown in Chinese growth and continued worries about the outlook for Euro zone countries. The trend has continued through the first half of 2013. Prices have also been volatile. The Steel Index, the index most widely used for pricing, registered a fall from $117 per mt (iron ore fines, 62% Fe, USD per dry metric ton, cfr Chinese ports) in early August 2012 to just above $86 in early September. Prices then recovered to a high of nearly $160 in early January 2013, only to drop to $110 in mid-June. The average price in the first half of 2013 was $136/mt. A further indication that steel companies face sluggish demand is that the premium for higher grade iron ore has trended downward, reflecting a reduced need for steel producers to maximize the output in their blast furnaces.
With almost all iron ore producers and steel mills having abandoned the benchmark pricing system, new price models are becoming more widely accepted. Practices for price setting vary widely and there are a number of published prices and indexes, each with a different product specification. There will be continued evolution of iron ore price models. The full effects of the new pricing mechanisms are unclear, but it is unlikely that the new models will have any major effect on price levels. It is, however, evident that price volatility will increase compared to the previous system, where prices were set once a year.
A solution to the skepticism about the representativeness of indexes could be the emergence of transparent futures markets with sufficient volume to deter would-be price manipulators. The industry is gradually coming to accept the need for active price risk management. Iron ore swap volumes at the Singapore Exchange more than doubled in 2012 and the increase was most noticeable from July to October—during the months of high-price volatility. This would seem to indicate that some market actors at least have decided that it is better to be protected against violent price swings than to take your chances and be at the mercy of the market. This trend is expected to continue, barring unforeseen events.
As for published prices, there are three competing price indexes (Metal Bulletin, Platts and The Steel Index [TSI]). Other prices are published on an informal basis. Hedging opportunities for iron ore are growing. The CME group, SGX (Singapore Exchange), London Clearing House (LCH Clearnet), NOS Group and ICEX (Indian Commodities Exchange) all offer cleared swaps based on TSI iron ore transaction data. In May 2012, two physical iron ore trading platforms—the China Beijing International Mining Exchange (CBMX) and GlobalOre—began operations. Based on experiences from other markets, it is likely that modern price risk management instruments will play an increasingly important role in the iron ore market.
Top Producers Increase Market Share
Vale remains the world’s largest iron ore producer at 320 million mt in 2012, a slight decrease from 2011, which at 323 million mt, was an all-time high. Its market share was 17.2%—still lower than its peak at 18.8% in 2007—and the gap between it and the second largest producer, Rio Tinto, has decreased. Rio Tinto improved by 10 million mt to reach a market share of 10.7%, also lower than its high of 10.8% in 2009. BHP Billiton increased its production by 14 million mt in 2012 to reach 187 million mt or 10%, up from 8.8% in 2011. BHP Billiton has grown at a faster pace than both Vale and Rio Tinto in recent years.
These three companies—two of which have most of their production in Australia—together controlled 37.9% of world production in 2012, up from 34.7% in 2011 and even higher than 2005’s 36.4%. The increase is the result of new production started mainly by Rio Tinto and BHP Billiton. Corporate concentration will most likely continue to increase, albeit slowly, as smaller projects are postponed or abandoned while the “Big 3” continue to increase output at a rate the market can accept. However, the rate of corporate concentration will increase if prices fall and many small Chinese producers are forced to close, while the “Great Chinese Shakeout,” which was started in 2008, continues. Although this process has been postponed as a result of Chinese demand holding up, the belief that it will ultimately happen is firm.
An alternative way to measure control of the global iron ore industry is to monitor the share of global seaborne trade of the top producing companies. Arguably, this method measures real market influence more accurately, since it excludes most captive production. Measured this way, the shares of the major companies are considerably higher than if they are estimated on the basis of production: Vale, the largest exporter, controls 25% of the total world market for seaborne iron ore trade and the three largest companies together control 59.8%. Vale’s share grew after several years of continuous decline. In 2012, the market shares of Rio Tinto and BHP Billiton also increased, from 16.5% to 17.9% and from 15.9% to 16.9%, respectively. The combined seaborne market share of the Big 3 has almost rebounded to the 60% figure achieved in 2009.
500 Million Tons of New Capacity Through 2015
New iron ore mining capacity brought into operation since May 2012, as identified at the individual project level, reached 125 million mt. As of May, the total project pipeline contained 771 million mt of new production capacity to come on stream between 2013 and 2015. Of this total, around 306 million mt falls into the category “certain,” 230 million mt “probable” and 235 million mt “possible.” Almost a third (32%) of these projects are in Oceania (Australia), 29% in Latin America, 13% in Africa, 11% in Europe, 4% in North America and 11% in Asia. In general, in any given year not all certain projects will make it and not all of the probable ones will become a mine in the period stated by the company handling the project, but the delay rarely exceeds three years. Most possible projects will not make it on time, but many will—eventually. In spite of these uncertainties, it can reasonably be estimated that around 500 million mt, with a low range of 390 million mt and a high range of 580 million mt, of new capacity will come on stream in the period up to and including 2015.
Expect Mild Growth, Favorable Prices
The world economic outlook has improved, although the rate of recovery remains slow and the target keeps receding. The International Monetary Fund’s World Economic Outlook, published in April, estimates the rate for world economic growth at 3.6% in 2013 and 4.1% in 2014. Prospects have improved in Japan and the United States, but Europe shows little dynamism, with austerity policies constraining demand growth. The World Steel Association’s latest short-term forecast for world steel use, released in April, anticipates a rise in world steel use of 2.9% in 2013, followed by a 3.2% increase in 2014. It is particularly notable that China’s growth is expected to slow dramatically from its previously very high rates.
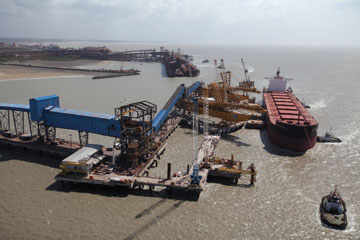 Pier IV at the Ponta da Madeira Maritime Terminal, São Luís, Brazil. Vessel Ore Belo Horizonte during the first docking test with load in the South Cot. (Photo courtesy of Vale)
The authors believe the forecast may be slightly too pessimistic in China’s case, but the caution is understandable, given that economic recovery has so far proved disappointing. It is important to emphasize that assumptions concerning China are absolutely decisive for the outcome, given its weight on the global steel market. Therefore, the successful reorientation of Chinese growth is essential both to the health of the world economy and to continued steel demand growth. The shift is likely to lead to slower growth in Chinese demand for steel and other raw materials. However, the shift is happening later than expected and its effects may be less dramatic than estimated. They project annual growth in China’s crude steel production to be 5% over the period 2013–2015, while steel production in the rest of the world would grow at a rate of 3.1% per year.
On the basis of an unchanged relationship between iron ore demand and crude steel production—disregarding the difference in trend growth rates due to declining scrap use since the recession has temporarily increased scrap availability—they estimate that iron ore use will increase from 1,863 million mt in 2012 to about 1,931 million mt in 2013 and 2,008 million mt in 2014.
The authors also predict that the world iron ore market will be characterized by tight conditions for a few years to come, although prices will decline as new production comes on stream. The main factors influencing the market are:
• Future Chinese steel demand will grow considerably slower than during the past decade, while demand from the rest of the world will increase.
• World steel demand and production will increase at rates that are high in a historical perspective, but lower than during the previous decade.
• Chinese iron ore production will remain significantly lower than domestic demand.
If only the certain and probable projects are taken into account, 536 million mt would be added until the end of 2015. Under these relatively conservative assumptions of demand, about 230 million mt would actually be needed. While this implies that a surplus will develop over the next three-year period, the authors are not prepared to conclude that the iron ore market is facing imminent reversal. First, as previously mentioned, there are reasons to believe that recent plans are somewhat optimistic. Second, the figures for capacity additions refer to what is added at the end of the year, and a part of it will not be in operation until late in the year. Third, our assumptions do not take into account ramp-up periods. Fourth, and most important, the market will be tight due to the existence of two mechanisms placing a cushion under prices: the large iron ore producers can implement their expansion plans with a great deal of flexibility, and a considerable segment of the Chinese iron ore mining industry, probably as much as 150 million mt in annual capacity, would close if prices were to fall dramatically below present levels.
Accordingly, the authors believe that the market is surely but gradually moving toward a balanced supply and demand situation. New supply capacity will gradually be added to meet a continuously growing demand. Prices, while declining slowly, will stay sufficiently high over the next few years to keep the Chinese iron ore mining industry operating at the 222 million mt produced in 2009 and the 281 million mt achieved last year. For the medium to long term, we will likely see a slow decrease in Chinese iron ore production, possibly down to 200 million mt/y. Consequently, prices will remain at historically high levels, with a floor at around $100/mt delivered in China.
Magnus Ericsson is CEO and founder of Raw Materials Group and member of the board of directors at Intierra. Intierra/Raw Materials Group is a Stockholm, Sweden-based mineral economics and policy analysis organization. Anton Löf is a research analyst with RMG, specializing in the global iron ore trade. Olle Östensson is a senior adviser at RMG.
Background information for this article was sourced from The Iron Ore Market 2012-2014, published by UNCTAD in July 2013. This study is researched and compiled by Raw Materials Group (contact Anto.lof@rmg.se or www.rmg.se) for UNCTAD, and can be ordered from: ironore@unctad.org, or by fax at +41-22 9170509.


