


After a precipitous fall in 2014, iron ore prices should stabilize—and even rise modestly—in the near future, but shifting global economic trends and the shadow of significant oversupply may squash any hopes for quick market rejuvenation
By Magnus Ericsson and Anton Löf
As the world economy and industrial production slowed in 2013, world crude steel production increased from 1,545 million metric tons (mt) in 2012 to 1,599 million mt in 2013, a rise of 3.5%, according to the World Steel Association (WSA). Chinese crude steel output reached 779 million mt, up 8.7%, alone accounting for most of the growth during 2013. Global production recovered from a slowdown in 2012 and rose 1.9%, but is still far from the levels achieved during the supercycle.
In Europe, steel production fell by 4.6% under the influence of shrinking industrial production. Steel production in Africa rose by 2.8%, the first increase since 2011. In the Americas, production fell by 2.1%. Many major producers experienced declines in crude steel production, including the U.S. (–1.9%), Brazil (–1.5%), Italy (–11.6%), Republic of Korea (–4.8%), Turkey (–3.4%), Russia (–1.7%) and Ukraine (–0.3%). Some countries noted increases, such as Japan (3.1%), India (5.9%), Taiwan (8.1%), Iran (10.9%) and France (0.5%).
The recovery in crude steel production after the global financial crisis has been almost entirely due to China. In 2013, most large producers in Europe and the Americas were still far from reaching their pre-crisis levels and growth rates in most of the OECD area are likely to be modest over the next few years. However, countries such as India, South Korea, Turkey and Iran have increased production above earlier records.
Despite the recent slowdown in growth rates, world crude steel production is currently running at a level slightly above that of 2013. But, while production figures were fairly good from June to August, there was a slowdown in September. Although it is possible that production rates will not pick up again during the fourth quarter, it seems likely that total 2014 crude steel production will set a new record.
 Iron Ore Market Growth: Back on Track
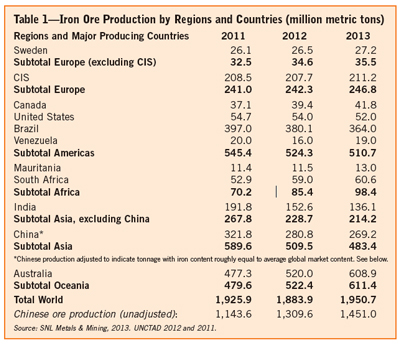
The global iron ore market, following a temporary slowdown in 2012, grew in 2013. Production increased 3.5% during the year to reach an all-time high at 1,951 million mt (See Table 1).
Output grew by 17.1% in Australia, the world’s largest producer, reaching 609 million mt. Among other producing countries, output increases were lower—and many registered a drop in production, including Brazil, China, India, the United States and Russia. Ukraine, Sweden, Canada and South Africa all increased iron ore production in 2013 compared to 2012.
Australia produced 245 million mt more than Brazil, the second-largest producer in 2013. While Australia increased its production in 2013 by 89 million mt, Brazilian production fell by 16 million mt (4.2%). Although many large scale projects in Brazil are under way and scheduled to come onstream in the near future, the country’s expansion rate remains slower than Australia’s.
Australia will remain the top producer for several years. India’s production has been stifled by government regulations and controversies over land use and the banning of exports. Some Indian mines have been shut down recently in an attempt by the authorities to combat illegal mining. The slow but steady and predicted decline of Chinese production, down by 12 million mt (4.3%), continued in 2013. Chinese production is estimated based on careful analysis of pig iron production in China and iron ore import statistics. These figures are considered to be more reliable than gross production figures, which do not consider the iron content of the ore produced.
World pellet production was steady but lower in 2013, falling by 1.4% from 448 million mt to 442 million mt in 2013. There is continued increased interest in pellets, especially DRI as the shale gas boom continues. When the iron ore market moves into an oversupply situation, however, fewer companies are willing to make the large capital investment in a pellet plant. In addition, rising production of direct shipping ore (DSO) has led to reduced growth in pellet demand relative to total iron ore demand.
Iron Ore Trade: 12 Years of Continuous Growth
Iron ore trade has increased faster than production, and the global seaborne market has grown primarily due to higher Chinese demand. In 2013, the international iron ore trade reached a record level of 1,283 million mt, up 12.8% compared to 2012. This is the 12th consecutive year of growth. The increase was almost entirely the result of higher demand from China. In 2013, most other countries saw trade levels similar to the previous year. Among the major importers, only Korea and Taiwan have reached and surpassed their import levels of 2008.
Australia’s exports rose by more than 100 million mt, from 470 million mt in 2012 to 579 million mt in 2013, an increase of 23.2%. Brazilian exports increased only 0.9% to 330 million mt. Exports from India fell yet again, to 15 million mt—what was once a thriving export industry as recently as 2009 when India exported 117 million mt, is now only a trickle as the political will to export has evaporated.
In 2013, China imported 820 million mt, a 10% increase compared to 2012. China now accounts for 65.7% of total world imports. In Japan, iron ore imports grew by 3.7% to 135.9 million mt. In the Republic of Korea, imports fell by 3.9% to 63 million mt. Taiwan increased imports by 18.5%. Taken together, the Southeast Asian region including China now accounts for approximately 84% of total trade of iron ore. The European market (excluding the CIS countries) saw imports increase by 4.7% reaching 128 million mt, equal to 10.2% of total world imports.
In 2013, the total seaborne iron ore trade increased by 13.1%, to 1,256 million mt—again mostly due to growing Chinese imports.
 Prices: Drifting Downward, But How Far?
Iron ore prices reached $159/t in February 2013, then drifted downward for the rest of the first half of the year to a low of $110/t. During the second half, there was a pickup in prices as imports into China reached record levels, and by the end of the year the price was around $135/t. While the first half of the year was influenced by a slowdown in demand from China and continued worries about the outlook for the Euro zone countries, the second half of the year was more positive with a renewed trust in the market. However, while imports into China rose, its crude steel production fell year-on-year and stock levels have risen in most major ports.
Prices dropped precipitously in 2014. The Steel Index—the index most widely used for pricing of iron ore—fell from $135/t (iron ore fines, 62% Fe, $ per dry mt, cfr Chinese ports) on the first trading day of 2014 to $78/t by the end of September—more than 40% lower. While demand from the steel producers increased during the year, albeit slower than in previous years, the price decline comes on the back of capacity additions in the industry. A further indication that steel companies face sluggish demand is the fact that the premium paid for higher-grade iron ore has only moved marginally. It stayed in the lower end of the spectrum of iron ore prices, reflecting a reduced need for steel producers to maximize output from their blast furnaces. During 2013, iron ore prices trended downward, while in early 2014 a slight increase was later reversed in the second and third quarters.
From 2013 on, practically all iron ore producers and steel mills have abandoned the benchmark pricing system. Practices for price setting vary widely and there are a number of published prices and indices, each with a different product specification. There will be continued evolution of iron ore price models. The full effects of the new pricing mechanisms are still not clear, but it is unlikely that the new models will have any major effect on price levels. It is, however, evident that price volatility will increase compared to the previous benchmark system, where prices were set once a year.
Based on experiences from other previously negotiated markets, such as aluminum and nickel, it is likely that modern price risk management instruments gradually will play an increasingly important role in the iron ore market.
The Big Three Tighten Their Grip
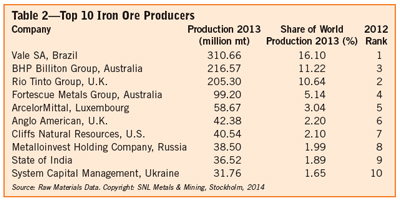
Vale remains the world’s largest iron ore producing company, at 311 million mt in 2013. However, this was the third consecutive year of lower production figures for the Brazilian major, after reaching a high of 323 million mt. Vale’s market share peaked at 18.8% in 2007, but fell to 16.1% in 2013 from 17.2% in 2012. Second and third rankings have shifted as BHP Billiton moved ahead of Rio Tinto—and also has managed to close the gap between it and Vale. BHP Billiton’s output grew by 30 million mt during the year to reach 217 million mt, with a market share of 11.2%. Rio Tinto increased production by 10 million mt in 2013 and reached 205 million mt. Its market share in 2013 was 10.6%, compared with 10.7% the year before.
The three largest companies, Vale, Rio Tinto and BHP Billiton—the last two with most of their production in Australia—together controlled 38% of world production in 2013. The market share of the “Big Three” has increased over the last few years, surpassing the previous high of 36.4% in 2005. The share increase is the result of new production coming onstream by BHP Billiton and Rio Tinto.
It is assumed that the Big Three will take a larger market share in the short term. During 2014, BHP Billiton and Rio Tinto further increased capacity while other smaller producers, especially in China, have been forced to shut down.
An alternative way to measure the control of the global iron ore industry is to monitor the shares of global seaborne trade of the top producing companies. Arguably, this method measures real market influence more accurately, since it excludes most captive production. Measured this way, the shares of the major companies are considerably higher than if they are estimated on the basis of production: Vale, the largest exporter, controls 24.7% of the total world market for the seaborne iron ore trade and the three largest companies control 58.3%, down slightly from last year’s 59.8%. Vale’s market share fell marginally after last year’s increase, continuing several years of decline. In 2013, Rio Tinto’s share fell from 17.9% to 16.3%. However, BHP Billiton increased its market share, from 16.9% to 17.2%. The combined market shares of the Big Three still don’t approach the 60% level of 2009, but the future may see a more concentrated industry as all Big Three producers have extensive plans for capacity increases.
Production Overcapacity will Continue
New iron ore mining capacity taken into operation during 2013, as identified at the individual project level, reached 156 million mt. In the first half of 2014, another 47 million mt of capacity was added and another 147 million mt are scheduled to come onstream in the second half of the year. Only marginal volumes have been depleted during the year.
The project pipeline contains 515 million mt of new production capacity to come onstream between 2014 and 2016 and another 91 million mt in 2017 from new mines and expansions. Of these projects, 37% will be located in Oceania (Australia), 40% in Latin America, 4% in Africa, 8% in Europe, 5% in North America and 6% in Asia. Typically, not every announced project will become a mine in the period stated, but the delay rarely exceeds 3 years. Many of the projects will be delayed and others will be postponed indefinitely, but some will eventually be completed. Global overcapacity will most likely extend for at least 1–2 years into the future.
Outlook: Oversupply will Stifle Price Increases
Global economic activity has strengthened since 2012 and early 2013 and is expected to improve further with much of the momentum coming from advanced economies.
However, global recovery is still fragile despite the improvements seen. The WSA’s latest short-term forecast for world steel use, released in October, anticipates a rise of 2% in world steel use in 2014, followed by another 2% in 2015. China’s growth in apparent steel use is expected to slow to just 1% in 2014 and 0.8% in 2015, a dramatic change from previous very high rates.
It is believed that the forecast may be slightly too pessimistic in the case of China. It is important to underline that assumptions concerning China are absolutely decisive for the outcome, given its weight on the global steel market. Therefore, the successful reorientation of Chinese growth is essential both to the health of the world economy and to continued steel demand growth. China will be able to maintain reasonably high growth rates, although, for a number of reasons, economic growth will be slower than in the past. However, those scenarios involving a dramatic loss of momentum in China are unlikely to materialize, mainly because China will still have a high rate of savings and so will be able to finance a high level of investment without external constraints. Its highly centralized political power should overcome resistance to any unpopular measures aimed at alleviating current problems.
Base case assumptions for China take as a starting point the simple observation that the high-growth rates seen in the early expansion of Chinese manufactured exports from a low base cannot be maintained indefinitely. As long as Chinese exports replaced output from other producers, it was relatively easy to maintain high growth. At present, however, with China moving into markets in which low labor costs are less of an advantage, and with Chinese labor costs increasing faster than those in the rest of the world, the limits of growth for Chinese exports are increasingly set by the rate of growth of the world market itself; that is, by the growth of other countries’ economies. Since almost all other countries grow slower than China, export growth rates will therefore have to come down.
In order to maintain economic growth at a higher rate than that of the surrounding world, albeit lower than in the recent past, Chinese growth will have to be reoriented toward private and public consumption rather than exports. At the same time, the share of output going to investment must decrease in order to make space for consumption, although investment in housing and domestic infrastructure will partly compensate for a fall in investment in export-oriented infrastructure and capital equipment.
The shift is likely to lead to slower growth in Chinese demand for steel and other raw materials. It should be noted, however, that the shift is happening later than expected and its effects may be less dramatic than expected. Annual growth in China’s crude steel production is projected to be 4.7% over the period 2014-–2016, while steel production in the rest of the world should grow at a rate of 2% per year.
On the basis of an unchanged relationship between iron ore demand and crude steel production—disregarding the difference in trend growth rates due to declining scrap use since the recession has temporarily increased scrap availability—it is estimated that iron ore consumption will increase from 1,950 million mt in 2013 to about 2,013 million mt in 2014 and 2,091 million mt in 2015.
The world iron ore market will be characterized by oversupply for at least 1–2 years to come. Iron ore prices will stabilize as production shutdowns take effect, but an increase in prices is not foreseen until the market is back in balance.
Accordingly, while the market is certainly in oversupply, price levels around $85–$95/t are unlikely to be sustained over the longer term because this would render uneconomic, not just a large part of Chinese ore production but also several high-cost mines elsewhere, as well as inhibit the long-term will to invest. On the other hand, prices will probably not increase by much over the present level for the next few years considering that new projects will further add capacity to an industry already in oversupply.
Background material for this article was extracted from the forthcoming iron ore briefing service to be researched and published by SNL Metals & Mining.
Magnus Ericsson, a frequent contributor to E&MJ, is a consulting professor in mineral economics at Luleå University of Technology, Sweden. Anton Löf is a Stockholm-based research analyst with SNL Metals & Mining, specializing in the global iron ore trade.


