


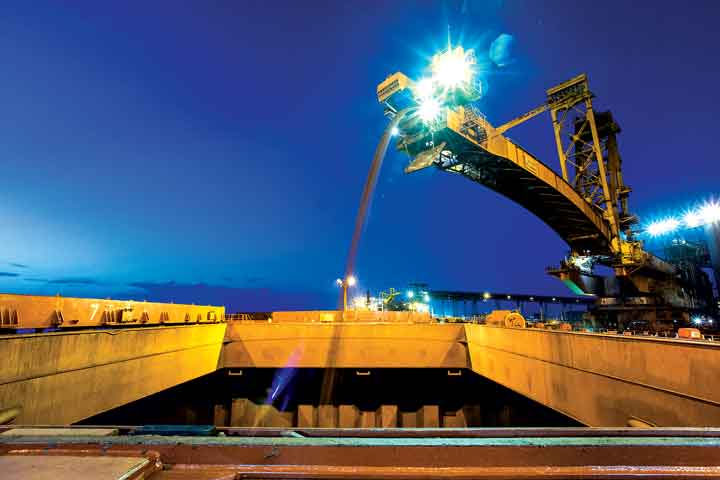
 Although both iron ore and iron pellet exports rose in 2014, the magnitude of their growth differed significantly: Global iron ore exports increased by 10% in 2014, while pellet exports grew by less than 1% from 2013 to 2014. (Photo: Marcus Coelho/Vale)
Weak growth and an oversupplied market will keep iron ore prices flat into the future
By Anton Löf and Magnus Ericsson
After a long period of rapid growth, iron ore demand has leveled off and prices have returned to levels not seen since 2002. The reorientation of China’s growth strategy has brought steel consumption growth almost to a stop, at least temporarily, and signs of demand picking up in other parts of the world have not been enough to offset the Chinese stagnation. At the same time, the world’s largest iron ore mining companies have increased production, mainly in Australia, leading to a substantial supply overhang. Closures of capacity, particularly in China, have not been large enough to compensate for the Australian expansion and many mining projects under development have been halted or delayed. The iron ore market is entering a new phase with slower growth, lower prices and tighter margins for mining companies.
PRODUCTION: UP SLIGHTLY, EVERYWHERE EXCEPT ASIA
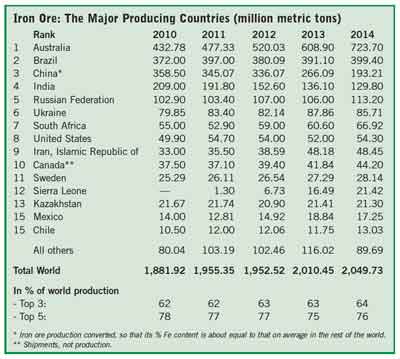
World iron ore production rose by a modest 1.9%, to 2,048 million metric tons (mt), in 2014. Production increased in all regions except Asia, where it declined by 21% in 2014 to 406 million mt. Asian production peaked in 2007 at 647 million mt and has declined almost every year since, mainly due to falling production in China and India. In China, output (with Chinese production converted to a standard 62% Fe content) fell by 21% in 2013 and 27% in 2014, to 193 million mt. In India, production declined by 11% in 2013 and 4.6% in 2014. At 130 million mt, India’s production was 42% lower than at its latest peak in 2009. Production of iron ore in Indonesia has fallen almost 100% following the political decision to ban exports of unprocessed material, effectively choking the industry—which had grown from 0.1 million mt in 2007 to 21.4 million mt iron ore in 2013—back down to 0.4 million mt in 2014.
Since 2003, world production of iron ore has grown by 63% or 791 million mt. In developed market economies (including Eastern Europe), except Australia, iron ore production increased by 23% during this period. Australian production grew, however, by 240%. In the CIS countries, iron ore production in the same period increased by 22%.
Production in these countries, despite the recovery in recent years, still has some way to go to reach the record levels of 250 million mt that was attained in the mid-1980s, and in the present market, this is not likely to happen. In Western Europe, production increased by 40% from 2004 to 2014, although at 36.8 million mt it is still modest from a global perspective. North America, Canada and the USA have added 14 million mt of iron ore production since 2005, growing by 17%.
A number of projects in Scandinavia and North America have been shelved or postponed due to the current low prices and it does not appear likely that the growth rates achieved over the past decade will be maintained in these regions. During the first half of 2015, production in non-traditional iron ore exporting countries, such as Honduras, Argentina, Myanmar, Thailand and others, has essentially stopped due to the low prices.
World pellets production declined by 1.8% to 461.4 million mt in 2014, after a 3.9% increase in 2013. World exports are estimated at 137 million mt, a marginal increase of 0.7% over 2013, when exports declined. Since 2011, when global pellets exports reached an historical peak, exports have shrunk by 11%.
GLOBAL EXPORT NUMBERS SHOW MIXED RESULTS
World iron ore trade increased rapidly in both 2013 and 2014, with exports growing by 11% and 10%, respectively. The growth in trade reflected changes in the geographical distribution of production, with a considerable increase in Chinese imports as a result of closures of domestic capacity in that country.
World iron ore exports have increased by 140% since 2003. Australia has been the primary beneficiary of mine closures in China and its exports increased by 24% to 717 million mt in 2014. Brazilian exports have grown less impressively, although they rose by 4.5% in 2014, to 344 million mt. South Africa is now the third largest exporter, at 66 million mt in 2014, as India’s exports have declined precipitously from the peak of 117 million mt in 2009. In 2014, Indian exports were just under 10 million mt, as both political limitations on exports and red tape on new projects has hampered the growth of the Indian iron ore sector.
China’s imports increased by 14% in 2014. At 933 million mt, China accounts for 67% of world imports and it accounted for 88% of the increase in world imports in 2014. Japanese imports were stable at 136 million mt. In the Republic of Korea, imports increased by 15% to 73 million mt. European imports (excluding the CIS countries), increased by 5.2% in 2014, reaching 135 million mt. These signs of a budding recovery are still far from the volumes imported before the global financial crisis.
In 2014, seaborne iron ore trade increased by 12% to 1,356 million mt, following an increase by 7.3% in 2013. As in earlier years, the increase was almost entirely due to higher Chinese imports. With the price decreases forcing local Chinese iron ore miners to shut down operations and the “Big 3” iron ore producers—Vale, Rio Tinto and BHP Billiton—increasing their low-cost iron-ore production, we can expect seaborne-traded iron ore to increase faster than the growth in total iron ore production in the short to midterm. This will effectively relocate some of the production and increase the importance of seaborne-traded iron ore.
 PRICES LEVEL OUT AFTER A STEEP DROP
After reaching their peak in late 2012, iron ore prices trended downward during most of 2013, and continued this trend in 2014. The decline accelerated in the autumn of 2014 and into 2015 but the steep price drops seem to have stopped in mid-2015 and prices have moved laterally between $50–$60/mt for standard 62% medium-quality fines delivered to China.
The main factor behind the fall in prices was the faster-than-expected increase in supply, particularly from the Big 3 producers. Together, the three increased production by 115 million mt in 2014. A slowdown in Chinese demand was the second most important factor. Chinese pig iron production, which is the best proxy for iron ore use, exhibited feeble growth in 2014, after having grown steadily in 2013. The combination of these two factors explains the rapid decline of iron ore prices. It is interesting to note that the decline in prices accelerated as of mid-2014, when the magnitude of the new supply became clear. During the second half of 2014 and the first few months of 2015, market sentiment became increasingly bearish. An illustration of this change in sentiment is that forward iron ore prices, which held up relatively well in 2014, declined more rapidly in 2015, particularly in March and April, as the contango on future markets disappeared. This meant that producers that had earlier been able to hedge and sell forward at prices significantly higher than the spot quotations lost the possibility to do so. Their financial position has therefore considerably worsened, as they can no longer finance stocks that way. The decline in futures prices can be interpreted as an indication that the market expects prices to decline further. It could also be a sign that futures markets for iron ore are not sufficiently liquid to accommodate contango financing on a scale comparable to that of other futures markets for metals.
It is notable that the “domestic premium”—the difference in price between Chinese ore and imported material—has remained constant or even widened somewhat as prices have fallen. Only part of the premium is explained by the grade difference between domestic concentrate and imported ore. The full increase in the domestic premium could also be a sign that the closures in the Chinese iron ore mining industry have reached a limit where the remaining mines are maintained and supported by steel plants as a supply-diversification measure. A similar development took place in late 2008 at the beginning of the financial crisis. It is estimated that 100 million mt of Chinese iron ore mining capacity has closed since the beginning of 2014 and 200 million mt since early 2012.
STEEL CONSUMPTION: A MINOR INCREASE
After some improvement in 2013, world economic growth faltered in 2014, mainly because of a slowdown in China and other emerging economies, while the developed world continued the trend of weak growth. As a result, world crude steel production, which had increased at a healthy rate of 5.8% in 2013, grew by only 1.1% in 2014.
Unlike recent years, China did not account for most of the increase in production. Chinese crude steel output increased by 0.9% to 823 million mt in 2014. In 2015, growth in Chinese crude steel production turned negative, with output declining during the first five months. But in the rest of Asia, it rose by 3.3%, to 316 million mt.
Excess capacity in the steel industry is growing. In 2014, the difference between capacity and production was 604 million mt, which implies a capacity utilization rate of only 73%. The Organization for Economic Cooperation and Development (OECD) projects capacity increases of just under 4% and 2%, respectively, in 2015 and 2016, which is likely to mean that the gap between capacity and production widens further.
Steel use increased by 0.6% in 2014, following a rise by 3.6% in 2013. For once, demand increased more rapidly in Europe (4.5% in the European Union) and North America (12% in the United States) than in the rest of the world, illustrating that the recovery in the developed world has been offset by a weakening in emerging economies. Steel use in China declined by 3.3% in 2014 after having increased by 8.4% in 2013. Growth in emerging and developing countries excluding China was 2.3%.
TOP THREE PRODUCERS RATCHET UP MARKET SHARE
The three largest iron ore companies—Vale, Rio Tinto and BHP Billiton—the latter two with most of their production in Australia, together controlled 39% of world production in 2014, the highest share ever. The market share of the Big 3 increased from 36% in 2013. The increase is the result of new production mainly from Rio Tinto and BHP Billiton, but also of closures elsewhere in the world, particularly in China.
Vale remains the world’s largest iron ore producer at 319 million mt in 2014 (up from 311 million mt in 2013 but down marginally from the all-time high of 323 million mt in 2011). Its market share fell slightly to just under 16% (down from a little more than 16% in 2013, and from the peak of 19% in 2007). In 2013, BHP Billiton recaptured the second position and pushed Rio Tinto down to third place. BHP Billiton had been expelled from its traditional position as No. 2 in 2000 when Rio acquired North. BHP Billiton has grown stronger than its two main competitors in the past years and has gained market share. In tonnage terms, the gap between No. 1 and 2 decreased as BHP Billiton increased its production to 253.5 million mt and its market share to 12%. Rio Tinto increased production by 14% to reach 234 million mt in 2014 and increased its market share to 11%.
Corporate concentration in the iron ore industry in 2014 increased at the level of the top three and 10 largest companies to reach new record levels at 39% and 61%, respectively, of world production. The consolidation process has advanced by leaps and bounds. The pace was slow in periods of only organic growth, such as in the late 1990s, but was much faster in times of intensive mergers and acquisitions (M&A) activities; for instance, in 1997 and also between 2000 and 2003. In recent years, it is again strong organic growth, which has fueled concentration and it will continue when Vale‘s expansion program continues during the next few years.
An alternative way to measure the control of the global iron ore industry is to monitor the share of global seaborne trade of the leading producing companies. Arguably, this method measures real market influence more accurately, since it excludes most captive production. Measured this way, the shares of the major companies are considerably higher than if they are estimated on the basis of production: Vale alone controls 21% of the total world market for seaborne iron ore trade and the three largest companies control 57%. However, Vale’s share declined in 2014. The total share controlled by the Big 3 is now almost back at the level of 60% attained in 2009 and their share is set to grow.
At the global level, the Big 3 have faced increased competition in recent years. In the short to medium term, however, they are tightening their grip on the iron ore industry, with all of them simultaneously expanding production and cutting cash costs. The high investment cost makes it difficult for companies without large financial resources to enter iron ore production. Iron ore projects are often burdened with investments in transport infrastructure, frequently constituting the major part of the investment costs. Therefore, in addition to financial strength, the established producers have advantages that decrease their marginal costs of expansion. They are able to expand existing operations, often through relatively minor additional investments in upgrading their transport systems. Moreover, they can open up new deposits close to existing mines, thus reducing the costs by expanding already existing process plants.
As of May, the total project pipeline contained 743 million mt of new production capacity to come on stream between 2015 and 2017; however, many of these projects will not arrive within their announced timeframe.
WHAT’S AHEAD?
Projections for world GDP growth have been cut back and the consensus is now for relatively modest growth in both 2015 and 2016. In the April World Economic Outlook update by the IMF, the forecast for world economic growth in 2015 is 3.5%. Relative to last year, the outlook for advanced economies is improving, while growth in emerging market and developing economies is projected to be lower, primarily reflecting weaker prospects for some large emerging market economies and oil-exporting countries. Growth in 2016 is forecast at 3.8%, mostly reflecting some waning of downward pressures on activity in countries and regions with weak growth in 2015, such as Russia, Brazil, and the rest of Latin America.
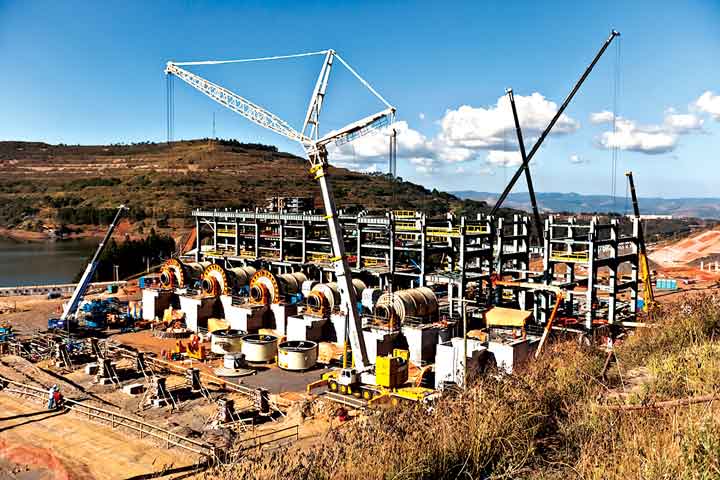 Vale, currently conducting a major expansion program (see related article on p. 28-32), was the top iron ore producer in 2014 with 319 million mt—up from 311 million mt in 2013, but under its historic peak of 323 million mt in 2011. (Photo: Vale)
Growth in world steel production has come to a halt, and to-date this year in China it has been negative. A scenario in which both steel demand and production in China will peak this year and then decline appears to be gathering support. The scenario is based on the apparently very rapid reorientation of Chinese growth. As we have argued in previous years, it is not the slowdown in Chinese growth per se that would lead to slower steel demand growth, but rather the reduced share of investment in Chinese GDP. This reduction is now happening and more rapidly than most observers would have believed. Since investment is much more steel intensive than consumption, the shift has a dramatic impact on demand for steel.
The World Steel Association’s short-term forecast for world steel use, presented in April, anticipates a rise in world steel use by 0.5% in 2015, followed by an increase of 1.4% in 2016.
It is important to emphasize that assumptions concerning China are absolutely decisive for the outcome, given its weight on the global steel market. Therefore, the successful reorientation of Chinese growth is essential both to the health of the world economy and to continued steel demand growth. We project annual growth in China’s crude steel production to be 0.5% in 2015 followed by slightly higher growth at 1% during 2016–2017, while steel production in the rest of the world would grow at a rate of 1.5–2% per year. This means that we do not agree with the view that China has reached “peak steel.” Although steel demand growth in China may be weak over the next few years and might even turn negative if the change in the growth mode happens faster than expected, healthy growth in consumer demand will support an increase in steel use.
Events over the past months can be described as a correction of a market where prices had lost contact with costs or, alternatively, as the consequence of a massive miscalculation on the part of the large iron ore mining companies.
The first description is valid insofar as it is proving possible to supply the world’s steel producers with iron ore at prices much lower than those that have prevailed over the past several years. According to this interpretation of the developments, the world iron ore market is now going through a much-needed restructuring that includes the closure of inefficient production capacity and the elimination of mines that were wasting capital. The industry cost curve is flattening and as a result, users of iron ore and processed products will no longer have to pay prices that have been inflated by a shortage brought on by a rapid expansion of demand and that resulted in income transfers to the owners of mines who could benefit from vast economic rents.
The second interpretation takes as its starting point that the three largest iron ore producers brought on more new capacity than the market could absorb, all of them apparently underestimating the capacity additions of their competitors. The implication of this interpretation is that the process of capacity closure may go too far and that shortages may materialize in the future.
Which interpretation is closer to reality may only become clear with the passing of time. What is clear, however, is that, regardless of which interpretation is right, the three largest producers have strengthened their market position. It is also clear that other producers will find it difficult to finance expansions or new mining projects. Producers in Africa and Canada, for example, who seemed to have a bright future a couple of years ago, will have to struggle to realize their plans. However, the hardship is not limited to these areas but affects the world in its entirety.
Given the trend break in Chinese steel use, it is no longer justified to assume, as in the past, that the relationship between iron ore demand and crude steel production will remain unchanged. Since scrap availability is a function of past steel use, we would expect the share of scrap in Chinese steel production to rise. This tendency seems to be confirmed by our estimates of Chinese iron ore production, which can only be reconciled with data on imports and pig iron production if scrap use in China has increased substantially, from 9% of crude steel production in 2012 to 15% in 2014. Accordingly, we estimate that iron ore use in China over the next three years will be constant, with the projected increase in crude steel production being provisioned by scrap. In the rest of the world, we estimate that iron ore use will grow at the same rate as steel use or by 2% per year. The resulting demand for iron ore would then increase from 2,048 million mt in 2014 to 2,067 million mt in 2015 and 2,087 million mt in 2016.
There are many iron ore mining projects in the investment pipeline, and considerable capacity is likely to be added over the next two to three years. We estimate that at least 145 million mt and perhaps as much as 370 million mt of new capacity will come on stream in the period up to and including 2017. Adding another 370 million mt to capacity is, considering the demand forecasts, a strategy that will necessitate the closure of some more expensive mines and it doesn’t seem unrealistic that some of these projects will see a certain lag before they can start production.
Consequently, the world iron ore market will be characterized by potential or actual oversupply for a few years to come. This will prevent prices from rising above a certain ceiling that will be set by the price needed to allow additional investment to proceed, particularly by Vale. The ceiling may be situated somewhere in the neighborhood of $80/mt, although exchange rate fluctuations may make it difficult to identify the ceiling price at any given time. The main factors influencing the market include:
- Chinese steel demand will grow considerably slower than during the past decade, while demand in the rest of the world will pick up, in spite of the uninspiring macroeconomic outlook in the Euro zone.
- This means that world steel demand and production will increase at rates lower than in the past decade, and closer to those experienced in the 1990s.
- New supply will come mainly from the three largest producers, who are expected to be somewhat more cautious in their approach to investment decisions in the future than they have been for the past several years.
The background material for this article is extracted from the forthcoming Iron Ore Market 2014–2016, published by the United Nations Conference on Trade and Development (UNCTAD). For further details, contact UNCTAD at ironore1@unctad.org or Anton Löf at alof@snl.com.
Anton Löf is associate director–production research and development, Sweden, at SNL Metals & Mining. Magnus Ericsson is adjunct professor of mineral economics in the Department of Business Administration, Technology and Social Sciences, Luleå University of Technology, Sweden.


