


While mine production mostly remained stable throughout 2015, other factors were in play in the gold market. E&MJ looks at the influences on supply and demand, and the developing trends.
By Simon Walker, European Editor
 According to initial estimates from Thomson Reuters GFMS, published in the organization’s fourth quarter update to its annual Gold Survey, world new-mined gold production totaled 3,126 metric tons (mt) last year, only marginally changed from the 3,120 mt reported for 2014. Total supply, which includes reprocessed scrap and net hedging, was 4,274 mt, compared with 4,375 mt the previous year, largely the result of what GMFS described as “a shift to net de-hedging.”
Looked at on a quarterly basis, total gold supply fell by 7% during the last three months of 2015, GFMS said, with the quarter “marking six of the past seven in which the gold market was in surplus.” Mine supply was down 4% on a year-on-year basis, representing the largest quarterly drop since 2008.
“Tied to this backdrop, it is hardly surprising that the bear market continued,” the organization added.
The GFMS data suggest that supply outstripped demand by some 370 mt last year, almost exactly the same as in 2014, once physical demand and the effect of inventory building on exchanges and exchange-traded funds (ETFs) had been taken into account. Consumer demand within the two countries that have acted as sponges for surplus gold in recent years—China and India—marked time during much of 2015, although there was a noticeable upturn in interest later in the year. China increased the value of its gold reserves to 1,762 mt by the end of December, worth $56.7 billion, with the addition of 104 mt during the second half of the year.
Meanwhile, Indian imports totaled more than 900 mt of gold worth some $35 billion in 2015, with 105 mt of imports in December alone. In tonnage terms, the total was 25% higher than in 2014, while the lower average dollar price during last year value meant that the cost of these imports was up about 12% year-on-year. GFMS believes that a little more than 700 mt of these imports were intended to remain in India, with the remainder brought in as duty-free for re-export after value addition in the jewelry sector.
On the producer side, the main focus worldwide has been on cutting costs. Most of the major producers were successful in this respect, with GFMS noting that total cash costs reported by the industry for the first nine months of 2015 fell by 7% on an annualized basis, to $680/oz. In addition to internal cost-cutting programs, much of the industry benefitted to some extent from favorable exchange-rate movements, while the fall in the price of oil helped producers across the world as diesel costs came down as well.
And while the dollar price of gold carried on slipping, with The Bullion Vault reporting spot prices having fallen 10% from $1,231 to $1,104/oz between January 2015 and January 2016, the strength of the U.S. dollar meant that the gold-price decline was not as marked in some other currencies. For example, in euros, the daily price fell from €1,044 to €1,013/oz over the same period, or just 3%, while producers with costs in Australian dollars saw the value of their output increase from A$1,512 to A$1,589/oz as their currency depreciated against the U.S. dollar.
It was even better for producers in countries such as South Africa and Russia, where local currency value per ounce rose by 20% and 13%, respectively, as the rand and the ruble slid.
For fuel costs, the New York spot price for diesel fell from $1.77 to $1 per U.S. gallon during 2015, according to figures from the U.S. EIA, although it has been common comment that the decrease in oil products, such as diesel, has not tracked the reduction in the crude oil price that consumers might have wished to see. In addition, remote mines have had less in the way of a benefit than might otherwise have been the case, given the cost of transport as a proportion of their final fuel bill.
Projecting ahead from confirmed third-quarter data, in its January Gold Survey update, GFMS predicted no changes in the relative rankings of the world’s top five gold-producing countries, with China still firmly at the top of the pile. Here, the organization estimated that production will have risen slightly year-on-year, a position mirrored to a lesser extent by Australia at No. 2 in the list. By contrast, Russian output is likely to have fallen below the 262.2 mt produced in 2014, with higher costs and the closure of some uneconomic alluvial mining operations largely responsible.
Indeed, the Russian gold sector has been subject to some unwelcome influences over the past year or so, as the devaluation of the ruble against the dollar and the effects of economic sanctions imposed by the rest of the world over Russia’s annexation of Crimea from Ukraine have taken hold.
In an interview reported by Bloomberg last December, the chairman of the Russian Union of Gold Producers, Sergey Kashuba, predicted that new Chinese investment may well prove to be a key to helping the industry maintain its position. “Chinese money may soon appear in Russian gold mining,” Kashuba was quoted as saying. “Chinese gold miners have skimmed off the cream at home so today they’re looking at Russia with interest. They recognize that the ruble devaluation has made mining in Russia more attractive.”
The Bloomberg article pointed out that although China’s gold output has achieved spectacular growth over the past 10 or 12 years, according to a recent report by the World Gold Council (WGC), its reserve base cannot support current output levels. The bulk of the country’s production comes from relatively small mines, with the report quoting figures of more than 600 mines involved in primary production, hence averaging around 300 kg (9,650 oz) each per year. On this basis, it is easy to see the point that Kashuba was making, insofar as a fair proportion of the “low-hanging fruit” in China’s gold deposits may already have been picked.
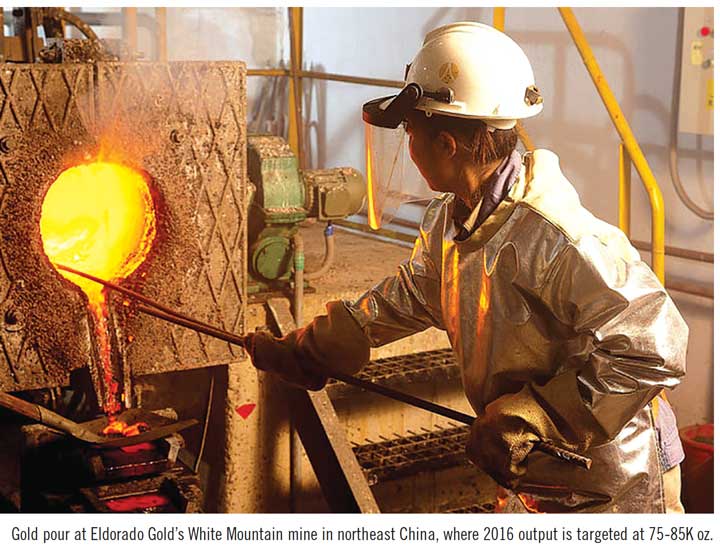
Nonetheless, exploration continues, with the announcement carried by People’s Daily and elsewhere last November of the discovery of a massive gold resource close to Sanshan Island, off the coast of Shandong province in eastern China. Gold mining is already well-established in the area, with Shandong Gold’s Sanshandao underground mine having been in operation since 1989. Challenges for development include the deposit’s depth—2,000 m—and the fact that it lies beneath the Bohai Sea.

AFRICAN DRIFT
Among the leading world producers, South Africa and Ghana both recorded lower output in 2015 than in the previous year. In Ghana’s case, some of the shortfall can be put down to AngoGold Ashanti’s decision to stop underground production at Obuasi, with the aim of developing a complete modernization plan for the mine. In September, AngloGold and Randgold Resources—partners in the new Kibali mine in the DRC—unveiled plans for a joint evaluation of the best way ahead for Obuasi, under which Randgold would lead and fund a development plan designed to rebuild Obuasi as a viable long-life mine.
In the event, Randgold decided that the challenge was too great, and withdrew from the joint venture three months later, saying that the project did not meet its investment criteria. Having reduced Obuasi to processing tailings, with work on the new access ramp that it started in 2012 continuing, AngloGold is carrying on with its feasibility study into transforming the mine into a mechanized high-grade operation, based on proven and probable reserves of 24.53 million mt grading 6.7g/mt.
“We have made a concerted effort to unlock a new opportunity for Obuasi, and the work we have done lays a good foundation for the operation in the long term,” AngloGold Ashanti CEO, Srinivasan Venkatakrishnan, said in December. “But in the current environment, we believe it is prudent to conserve our resources and to revisit this opportunity when market conditions improve.”
South Africa’s decline from world leader to the current No.7 can be put down to three main factors: the cost of labor, the cost of electricity, and the depth of the mines. The resources are there in the ground, but the economics of turning those resources into reserves are looking increasingly uncertain.
In an article published in the Wall Street Journal last September, columnist Alexandra Wexler quoted Sibanye’s Senior Vice President Dawie Mostert as saying, “This is an industry that’s mature, old and in some degree of distress.”
Wexler went on to state that if South Africa’s largest gold miners are going to survive beyond the next few decades, a radical reshaping of the industry is necessary. Most are investing heavily in new technologies to reduce labor costs, she explained, citing Chamber of Mines of South Africa data that show how the cost of labor has risen by 180% over the past decade. Add to that electricity costs that more than tripled between 2008 and 2014, and the problems are writ large.
AngloGold Ashanti’s Venkatakrishnan summarized the situation in a Bloomberg interview around the same time. “What you’re seeing in South Africa is a major margin squeeze,” he said. “If you do nothing, the future of South African gold mining always heads towards a declining trend.”
Bloomberg’s own analysis of second-quarter 2015 company results showed that, on an all-in sustaining cost basis, South Africa’s four largest producers were then losing money on about 35% of their production, with costs at around half of the country’s operations above the current gold price. Bloomberg quoted Bruce Williamson of Imara Asset Management as saying, “The industry is stuck in a time warp,” he said. “Every time they tried to innovate, it would prove too difficult and too costly so they fell back on the low-cost, low-skill model.”
However, “that low-cost mining is getting more expensive,” the article pointed out, as the mining companies and the unions tried to negotiate a new wage deal. “Without an agreement, South Africa’s gold industry will continue its decline,” Venkatakrishnan stated. “What you’ll see is companies cutting short the life of mines.”
DEMAND TRENDS IN 2015
In its full-year update on demand trends, issued in early February, the WGC stated that gold demand remained resilient in 2015 as central banks and consumers spurred a strong second-half recovery after a turbulent first six months. The organization noted that the recovery was particularly evident in the retail investment sector, where the bar and coin market was strong in China, Europe and the USA.
With demand totaling 985 mt and 849 mt respectively, China and India continued their dominance in the global gold market, accounting for close to 45% of total gold demand during 2015, the WGC said.
Global investment demand grew by 8% during 2015, reaching 878 mt, while the ETF market saw a slowdown in outflows: 133 mt in 2015, compared to 185 mt in 2014. Overall jewelry demand fell by 3% to 2,415 mt. Central Bank demand was around 40 mt higher in 2015 than in 2014, at 588 mt, as the need for further diversification was reinforced by a tumbling oil price and reduced confidence in the global economy.
The WGC’s head of market intelligence, Alistair Hewitt, commented, “In a year that saw global economic and stock market turmoil, the first US interest rate rise in nine years and falling oil prices, demand for gold remained resilient, coming in at 4,212 mt for the full year. Official sector purchases, combined with strength in the Asian markets and continuing momentum in the U.S. and Europe, reinforced gold’s credentials as a portfolio diversifier, a wealth preservation tool and a hedge against a range of risks.
“Looking ahead, physical demand will continue to be supported by strong central bank purchases, and continued buying of jewelry, bars and coins by households across the world, led by India and China,” he added. “If we just look at the year to date, the investment case for gold is as strong as ever. While stock markets have wobbled, gold has performed well.”
The WGC report noted that risk management through diversification continued to fuel official sector demand for gold, with central banks adding to their gold reserves with renewed vigor in the second half of 2015 as diversification of foreign reserves remained a top priority. Russia’s central bank added some 200 mt to its reserves during the year, while it became known that China’s central bank has accumulated over 600 mt of gold since 2009.
The period between 1995 and 2009 was marked by net central bank sales of gold holdings each year, reaching over 600 mt in both 2003 and 2005. Since 2010, however, the opposite trend has dominated, with net central bank buying reaching a peak of 625 mt in 2013. In terms of total central bank holdings, the USA tops the list with 8,133 mt, with other large-scale holders including Germany, Italy, France, China, Russia and Switzerland—together with the International Monetary Fund—all of which have more than 1,000 mt in their vaults.

INDUSTRY ROUNDUP
Most of the world’s big gold-producing companies announced their results for 2015 in February. First out of the blocks, however, was Russia-focused Polyus Gold, which reported the production of 1.76 million oz, up 4% year-on-year. Achievements during the year included progress in debottlenecking and increasing processing capacities at its Olimpiada and Blagodatnoye mines, where the mills operated 19% and 25% above their nominal capacities respectively, and the first gold pour at the company’s new Poputninskoye operation. The company did not reveal its production costs.
Bought out at the end of last year by at Kerimov family interests, its majority shareholder, Polyus Gold International was delisted from the London stock exchange, with Polyus Gold now only quoted in Moscow. In December, the company announced a joint venture with fellow-Russian Polymetal over the development of its Nezhdaninskoye deposit, which has resources reported at 20.3 million oz at a grade of 5.1 g/mt. This followed an agreement earlier in the year with China National Gold Group Corp. over future cooperation with procurement, engineering and project development.
Australia’s leading gold miner, Newcrest, produced 2.49 million oz in calendar 2015, with all-in sustaining costs averaging $763 over the year. Its output in the financial year to the end of June 2015 was 2.42 million oz, up just 1% on 2013-2014, while all-in sustaining costs for the period of $789 were markedly lower than the $ 897 reported the year before.
The ramp-up at Cadia East helped to offset reduced production from Ridgeway, with Newcrest seeking approval for an increase in throughput at Cadia from 27 million to 32 million mt/y.
The first North American major to report, Kinross Gold, produced 2.6 million oz of gold equivalent during 2015, down from 2.7 million oz in 2014. The company’s all-in sustaining cost of $975/oz of gold equivalent was virtually unchanged year-on-year. Adverse weather affected its Maricunga (Chile) and Paracatu (Brazil) mines during the year, resulting in lower output, although production rose at its far-east Russian mines.
Benefitting from other companies’ divestment plans, in January Kinross paid Barrick Gold $610 million for two Nevada assets—the Bald Mountain mine and the 50% of Round Mountain that it did not already own. In Mauritania, it is finalizing studies on a two-phased expansion plan at Tasiast, while in Russia, production is expected from the September Northeast target near its Dvoinoye mine in late 2017, and from Moroshka, near Kupol, in 2018. Kinross expects to produce 2.7 million-2.9 million oz of gold equivalent this year, despite the planned closure of Kettle River-Buckhorn.
BARRICK TOPS AGAIN
Barrick’s 6.12 million oz of gold in 2015 were produced at an all-in sustaining cost of $831/oz, resulting in positive free cash flow for the first time in four years, the company reported. Nonetheless, Barrick recorded a net loss of $2.84 billion for the year, following $3.1 billion in impairment charges relating to adjustments to its short- and long-term gold-price assumptions to $1,000/oz for 2016 and $1,200/oz thereafter.
The company’s top producers, Goldstrike and Cortez, reported gold production of 1.05 million oz and 999,000 oz respectively. Its 60% stake in Pueblo Viejo added 572,000 oz, with the remainder accruing to its partner there, Goldcorp. Other big producers included Lagunas Norte (560,000 oz) and Valadero (602,000 oz).
Recent divestments have included its holdings in Bald Mountain and Round Mountain to Kinross, Spring Valley, Ruby Hill, Cowal, and 50% of Barrick (Niugini) to Zijin Mining. It also began a streaming agreement with Royal Gold over gold and silver production from its share in Pueblo Viejo, receiving $610 million upfront with future per-ounce payments.
Newmont achieved its 2015 attributable production of 5.04 million oz at all-in sustaining costs of $898/oz, 10% lower than in 2014. The company reported free cash flow doubled to $756 million, with net profits for the year of $507 million.
Geographically, Newmont’s production came from its U.S. operations (1.6 million oz), Asia-Pacific (2.05 million oz), South America (537,000 oz) and Africa (805,000 oz), with major individual contributions from Carlin (886,000 oz) and Boddington (794,000 oz). Other significant producers included Akyem, Twin Creeks, Yanacocha and Tanami, where an expansion plan is under way.
Development projects include Merian and Long Canyon, with Newmont having paid AngloGold Ashanti $820 million for the Cripple Creek & Victor mine last year. An expansion there encompasses a new leach pad, recovery plant and mill. In October, Newmont completed the sale of its Waihi mine in New Zealand to OceanaGold, realizing $101 million, bringing its income from non-core asset sales to $1.7 billion over the past two years.
With operations at its sole remaining South African mine, South Deep, still being optimized, Gold Fields reported 2.16 million oz of gold production in 2015, at an all-in sustaining cost of $1,007 for the year. South Deep itself contributed 198,000 oz, whereas the company’s main production came from its Australian (988,000 oz) and Ghanaian (753,900 oz) operations. Cerro Corona in Peru added a further 295,600 oz.
In its full-year report, Gold Fields noted that the mining fleet at South Deep was optimized during 2015, with 24 new machines delivered and a further 17 scheduled to arrive this year. The mine also managed to fill most of its critical skill positions in both mining and engineering, with improved performance expected this year and production predicted at 257,000 oz.
In August, the company sold out its interest in the Woodjam copper-gold-moly prospect in Canada to its partner, and is evaluating future options for its Damang operation in Ghana.
SIBANYE TARGETS PGMS
Goldcorp reported production of 3.46 million oz in 2015, achieved at an all-in sustaining cost of $852/oz before inventory impairments. The company commissioned two new mines during the year, which ended with free cash flow of $335 million compared to negative $1 billion in 2014. After taking $3.9 billion in impairment charges, Goldcorp posted a $4.2 billion net loss for the year against a loss of $2.16 billion in 2014.
The company’s two new mines, Cerro Negro in Argentina and Éléonore in Québec, produced 268,100 oz and 507,400 oz, respectively, at all-in sustaining costs of $1,007 and $769/oz. In Mexico, Peñasquito achieved a record 860,300 oz at $544/oz, while Red Lake in Ontario won 375,700 oz at $906/oz.
Goldcorp is currently working on brownfield expansion opportunities at Peñasquito (pyrite leach and the Camino Rojo oxide projects), Musselwhite (materials handling), Red Lake (HG Young and Cochenour) and Porcupine (the Borden prospect).
Production at Sibanye Gold dropped only slightly in 2015, from 1.59 million oz to 1.54 million oz. Average all-in sustaining costs were also $40 lower, at $1,031/oz. The company reported that it had been a year of two halves, with the second markedly better than the first, which had been affected by load-shedding by the state power utility, Eskom. Sibanye benefitted during 2015 from higher received gold prices, reflecting the devaluation of the rand against the dollar.
Diversification is a key element in Sibanye’s future strategy, with a proposed $294 million acquisition of Aquarius Platinum following its agreement in September with Anglo American to buy the Rustenburg platinum operations for at least $290 million. Sibanye CEO Neal Froneman noted that Rustenburg provides an attractively priced entry at an advantageous moment in the price cycle, being similar in nature to Sibanye’s gold operations.
Finally, AngloGold Ashanti reported the production of 3.95 million oz of gold last year, down from 4.44 million oz in 2014. All-in sustaining costs fell from $1,020/oz to $910/oz year-on-year. A major highlight of the year was the production of the 1-millionth ounce at Tropicana in Western Australia, after just two years of operation. The company sold its Cripple Creek & Victor mine in Colorado to Newmont, but its proposed joint venture with Randgold Resources at Obuasi in Ghana came to naught.
Safety-related stoppages were mainly responsible for a fall of 112,000 oz at AngloGold Ashanti’s South African mines, to 1 million oz in 2015. The company’s other African mines produced 1.44 million oz, with 831,000 oz from the Americas and 560,000 oz from Australia.
A Century Ago: Gold in 1915
According to data compiled by the Mineral Resources Department of the Imperial Institute (the predecessor in this task of the British Geological Survey), world gold production in 1915 totaled 710 mt. South Africa was by far the leading producer, accounting for 40% of the world total on its own, with the mines of the Witwatersrand—and a few others—winning 282 mt.
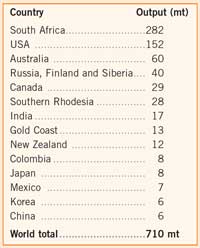 Second place in the producers’ table, the USA’s output that year was reported to be 152 mt—and these were the only two countries in which annual output exceeded 100 mt. Indeed, it is nearly fair to say that they were the only two that produced more than 50 mt, although Australia just managed to deny them that accolade, having produced 60 mt in 1915.
Other significant output was sourced from Russia (with which the Imperial Institute combined data for Finland and Siberia), Canada, Southern Rhodesia (now Zimbabwe), India and the Gold Coast (now Ghana). In Latin America, Colombia and Mexico were the principal contributors to world production, while in the Far East, Japanese and Korean output came to a combined 14 mt. Gold mining in today’s world leader, China, seems to have been very limited 100 years ago, with the Imperial Institute providing an estimated value of 200,000 oz, or about 6 mt.
With World War I then affecting national economies, world gold production was on a downhill trend, from 720 mt in 1913 to 574 mt in 1918. For example, U.S. output peaked in 1915 but had fallen from 152 mt to 103 mt by 1918. Two years later, the situation was even worse, with U.S. mines producing just 74 mt of gold in 1920.
The reasons for the decline were two-fold: the call-up of manpower for the world’s armed forces, and a gold price that had been fixed since 1879 at $20.67/oz. With fewer miners and cost inflation because of the war, more and more mining companies felt the pinch.
On a purely academic level, it is interesting to speculate what the world’s gold industry would look like today if the price of an ounce of gold had remained the equivalent of that $20.67. Adjusting for historical inflation is always a tricky exercise, with different values being applied to consumer prices and commodities. However, as a general guide, most calculators seem to suggest that a value of about $500 is somewhere near right.
Putting that into perspective, how many mines in operation today would be able to make a profit on $500 gold? Precious few, if the GFMS cost curve is anything to go by.


