


The industry’s major players are culling noncore assets, cutting costs and paring project investment budgets as they await signs of market recovery
By Joseph F. Govreau
After a period of intense mining project development, driven by increased emerging market consumption of building-block commodities such as coal, copper, and iron ore, the mining industry now finds itself in a period of cost cutting and capital preservation. Between 2005 and 2015, mining firms worldwide constructed and started up more than 1,230 greenfield mines representing total investment value of $265 billion. The mining boom, which included greenfield mine construction and expansions of existing mines, really peaked in 2012, but significant spending for major mining projects continued in 2013 and 2014, albeit at a lesser rate, as large projects that had started in earlier years reached peak construction.
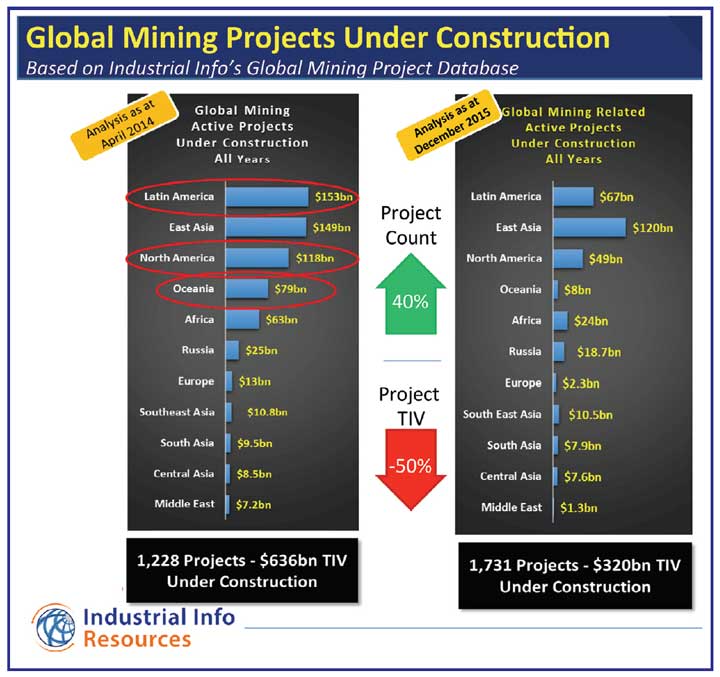
In 2015, construction activity at mining projects worldwide declined by 50%, based on the total investment value of projects when compared to a year earlier.
According to Industrial Info’s Global Mining Project Database, at the beginning of 2014, there were 1,228 mining projects totaling $636 billion under construction worldwide. This includes any significant capital expenditure of $1 million or greater, including greenfield mines and mine infrastructure, as well as mine/plant expansions, additions, modernizations, upgrades, etc. By the end of 2015, the number of mining projects under construction had increased to 1,731, but the total investment value had declined to $320 billion.
GREENFIELD PROJECTS ON THE BACK BURNER
Given today’s market conditions, the magnitude and type of projects being developed going forward will be different, at least for the next year or two.
Mining companies, for the most part, are shelving large greenfield projects and are focusing on productivity optimizations for newly developed assets, as well as brownfields, expansions of existing assets, in-plant capital and environmental spending. Project timelines will be slowed down and stretched out during this period.
While the majority of greenfield project activity, especially mega-projects, is being shelved or delayed indefinitely, a small amount of greenfield activity will continue during this period. Companies will need to replace capacity lost from mines due to depleting reserves and declining ore grades. Newmont Mining is a good example of this: Construction started earlier this year on the $293 million Long Canyon mine, the company’s next gold mine in Nevada. The mine will utilize the heap-leach process to recover 150,000 ounces per year (oz/y) when it is completed in late 2016.
In one of the biggest announcements for a country that’s been battered by the decline in commodity prices, Rio Tinto will begin construction in 2016 on the $1.9 billion South of Embley bauxite project in Queensland, Australia. The project involves an open-pit mine, processing plant, diesel power station, water pipeline, sewage treatment plant, and rail and port facilities. The project will initially produce about 22.5 million tons of bauxite per year when it starts up in 2019, and it will replace capacity lost from the depleting Weipa mine. Bechtel is providing engineering, procurement and construction management services for the project.
NEW COMMODITY PRICE PARADIGM
Most of the major mining firms are slowing down production to conserve resources during this period of low commodity prices. Layoffs, mine closures and project delays, which proliferated in 2015, will continue in 2016 as the industry continues to adjust to the new low-price commodity fundamentals. Most major mining companies will reduce capital expenditures in the range of 20%–25% in 2016. Freeport McMoRan, for example, has announced capex reductions of 25%, and Glencore Plc announced a 24% cutback for 2016. Large, low-cost producers such as Rio Tinto and BHP Billiton will fare better in 2016, while smaller and high-cost producers and junior mining companies will suffer the most. The current mood in the mining industry is to “batten down the hatches,” conserve cash and resources, and weather out the storm—the storm in this context being muted demand and low commodity prices for most metals, including copper and iron. Miners have taken notice and started a series of cost-cutting measures.
WHEN WILL COMMODITY PRICES REBOUND?
Instead of a rebound in 2016, it appears that the industry may be on a more extended correction, with slow sporadic growth over the next two to four years as commodity prices stabilize and rebound.
When it comes to commodity consumption and subsequent mining project development, China cannot be ignored: It consumes 40% to 50% of the world’s commodities, including aluminum, copper, nickel, zinc, lead, coal, iron ore and steel. But China’s appetite has waned. Double-digit GDP growth in China has given way to 6%–7% growth projected through 2017. China’s growing urban population boom and the subsequent build-out of infrastructure, commercial/residential construction and energy-related projects has slowed. That’s why countries like Australia and Indonesia, which rely on China for a good portion of their iron ore and coal exports, are currently reeling from the slowdown in demand and subsequent commodity price deterioration.
Not only is China a major importer of these commodities, but also a major miner. China is now the second-largest country for active mining project development after Canada. While near-term prospects for mining project development remain challenged at least into 2017, long-term growth prospects for the consumption of commodities remain positive, especially in the emerging economies where demand is expected to grow.
India is expected to eclipse China as the GDP growth leader with 7% growth expected in 2016, and it is in desperate need of infrastructure. If India can solve corruption problems and a lengthy permitting process, there could be growth in mining project development in that country. State-owned coal miner Coal India recently announced that it would build an additional 15 coal preparation plants near its mines in India.
WHAT COUNTRIES WILL SEE MINING INVESTMENT?
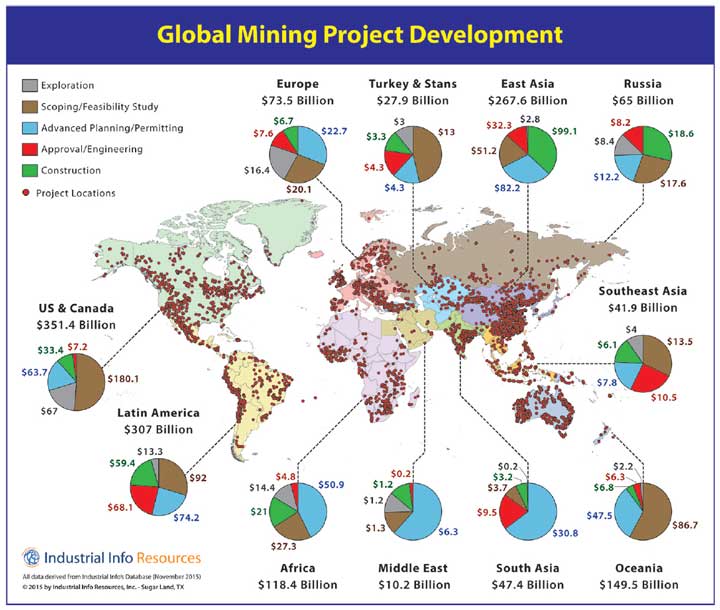
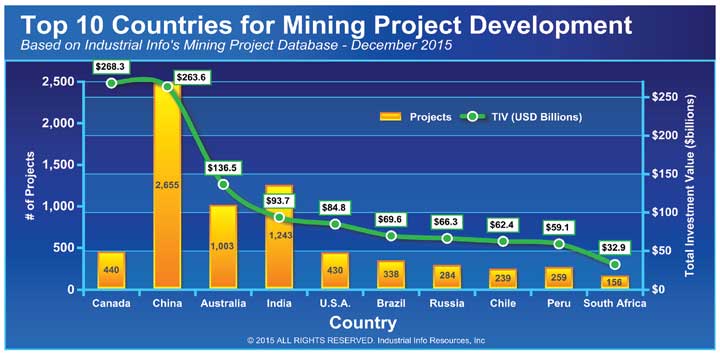
Going forward, the usual suspects will continue to dominate mining project development. The top 10 countries for active mining projects based on largest total investment value of projects are Canada, China, Australia, India, the U.S., Brazil, Russia, Chile, Peru and South Africa. These countries account for 75% of global mining project development.
Latin America continues to be one of the world’s hottest regions for mining project investment. The region holds more than 25% of the mineral exploration market and more than 45% of the world’s production of silver and copper. With more than 800 projects totaling $307 billion, Latin America accounts for about 20% of the world’s mining projects based on total investment value, according to Industrial Info’s Global Mining Project Database. Leading Latin American countries for mining project development include Brazil, Chile and Peru, which have vast reserves of iron ore, copper and gold, to name a few.
There’s growing activity in African countries, which have emerged as a destination for mining projects to supply metals and minerals to Asian countries. Both China and India are investing heavily in mining projects in Africa. For example, China-based Zijin Mining Group, the largest miner of gold and second-largest miner of copper in China, recently acquired 49% of the Kamoa copper project in the Republic of Congo.
Right now, mining firms are developing $118.4 billion in active projects in Africa. South Africa continues to be the mining epicenter in the continent, with 156 projects totaling $32.9 billion. In addition, significant projects are being developed in Congo, Mozambique, Guinea, Tanzania, Namibia and Botswana, to name a few.
In Ethiopia, Norway-based Yara International is proceeding with plans to construct a $740-million potash mine using solution mining technology. SNC Lavalin has recently received the award for the front-end engineering design, as well as engineering procurement and construction management.
IRON ORE: OVERCAPACITY IS AN OBSTACLE
Mining firms are developing 836 iron ore projects totaling $249 billion worldwide. China, Australia, Brazil and India are the top four iron ore mining countries in the world based on production. So it is not surprising that these four countries are in the top five, along with Canada, for iron ore mining project development, accounting for 62% of the world’s iron ore mining projects.
Like other metal commodities, iron ore prices have dropped to 10-year lows and are predicted to remain low. New capacity coming online, like the Roy Hill mine in Australia, certainly won’t help the situation. China’s steel industry, which has experienced phenomenal growth over the past 10 years, is in overcapacity. The country has started to remove some inefficient capacity, but much more will need to be removed to remedy the situation. This doesn’t bode well for iron ore suppliers, which have added significant capacity in recent years.
The big iron ore producers, such as Rio Tinto and BHP Billiton, continue to expand in Australia at a reduced pace. At a time when new iron ore mines don’t appear feasible, Rio Tinto is studying its next iron ore mine in Australia, the Silvergrass project, and could select an engineering, procurement and construction management firm in early 2016.
COAL THRIVES OUTSIDE THE U.S. AND EUROPE
China is the world’s largest coal producer, producing four times as much as the U.S., which is the second-largest producer. India, Australia and Indonesia round out the top five coal producers. Worldwide, coal mining firms are developing more than 3,000 projects totaling $394 billion. China accounts for 53% of the value of coal mining projects under development worldwide. Australia, India, Russia and Poland round out the top five countries for coal mining project development.
Coal has taken a hit in the U.S. and Canada due to a combination of low natural gas prices and environmental regulations that has expedited deterioration of the coal mining industry and discouraged future growth, in spite of the fact that coal will supply around 30% of U.S. power needs in the foreseeable future (down from about 50% just a few years ago). What is needed to save coal mining in the long term is development of revolutionary new clean coal technology that is economically feasible. Carbon capture technology has yet to achieve that milestone. In Europe, many countries are turning away from coal as a fuel source. The U.K. has announced plans to close all coal mines by 2035.
But while new coal mine development is bleak in North America and parts of Europe, elsewhere it is thriving as countries look to capitalize on the inexpensive abundant and secure energy source. China is consolidating its coal mines. India is developing as many coal mines as it can and has been increasing imports of coal to satisfy growing demand.
COPPER: CUTBACKS ARE NOW THE NORM
Mining firms are developing more than 750 projects, totaling $224 billion in copper ore mining projects worldwide.
Copper mining companies, including Codelco, Freeport-McMoRan and Asarco LLC, a wholly owned subsidiary of Grupo Mexico, continued cost-cutting measures in 2015. Freeport McMoRan shuttered the Miami mine in Arizona and reduced output at other mines, including the Tyrone mine in New Mexico and Climax Molybdenum’s Henderson mine in Colorado, as well as mines in Chile, Congo and Indonesia.
Freeport McMoRan will continue to operate the Miami copper smelter, which receives concentrate from several copper mines in Arizona. The company had previously decided not to proceed with a $450 million smelter environmental upgrade and expansion, which now has been reduced in scope to encompass the environmental improvements only. A decision on whether to proceed with the project will be made in early 2016.
Asarco indefinitely shut down the Hayden concentrator and curtailed production at the Ray mine, both in Arizona.
Chilean copper miner Codelco announced similar cost-cutting measures at its operations, including suspension of new hires, and is also re-evaluating expansion plans at its mines in Chile. Current projects under construction are being extended over a longer period of time. Codelco recently announced it will cut its five-year capital expenditure program by about $4 billion, from a previously announced $25 billion to somewhere between $21 billion–$22 billion. During the down market, the company will stretch out major expansions at its mines in Chile.
In 2016, mining companies will continue to battle low commodity prices by conserving capital and metal resources, and shifting focus from large greenfield or expansion projects to smaller incremental expansions and productivity optimizations at existing mines, in an effort to improve profitability in the near term. Long-term plans for organic growth will continue, but at a more conservative pace as the industry waits for demand/commodity price improvements.
This article was prepared for E&MJ by Industrial Info Resources and written by Joseph F. Govreau, vice president of research for its metals and minerals industry group. Texas, USA-based Industrial Info Resources (www.industrialinfo.com) has been a leading provider of global industrial market intelligence since 1983.
Major Mining Projects Worldwide, Year-end 2015*
Project Name Location Status Type Products Owner Project Cost (US$M)
Gold
Donlin Creek USA Feasibility OP Au Barrick, NovaGold Resources 6,700
Cerro Casale Chile Prefeasibility OP Au, Ag Barrick, Kinross Gold 6,000
KSM Canada Prefeasability OP Au, Cu Seabridge Gold 5,312
Galore Creek Canada Prefeasibility OP Au, Ag NovaGold Resources, Teck 5,208
Metates Mexico Prefeasibility UG Au, Ag Chesapeake Gold 4,360
Dome Mountain Canada Susp, restart/feasib UG Au Metal Mountain 4,187
Olimpiada Russia Operating, exp/plans OP Au PolyusGold International 2,500
Rosia Montana Romania Feasibility OP Au, Ag Gabriel Resources 2,500
Caspiche Chile Prefeasibility OP Au, Ag Exeter Resource Corp. 1,967
Courageous Lake Canada Prefeasibility OP Au Seabridge 1,520
Konevinskoye Russia Operating, exp/plans UG Au Vertex, Rusfinansgrup 1,400
Hycroft USA Operating, exp/feasib OP Au, Ag Allied Nevada 1,322
South Deep South Africa Operating, exp/plans UG Au Gold Fields 1,156
Bakyrchik Kazakhstan Susp, restart/feasib OP, UG Au Polymetal 1,124
Bystrinskoye Russia Feasibility OP Au, Cu Norilsk Nickel 1,100
Bloemhoek South Africa Feasibility UG Au Sibanye Gold 1,000
Stibnite USA Prefeasibility OP Au Midas Gold 1,970
Meliadine Canada Prefeasibility OP, UG Au Agnico-Eagle 1,911
New Prosperity Canada Feasibility OP Au, Cu Taseko 1,807
Spanish Mountain Canada Prefeasibility OP Au, Ag Spanish Mountain 1,756
Jiama China Operating, exp/feasib OP, UG Au, Cu China Gold Intl Resources 1,716
Fruta del Norte Ecuador Prefeasibility OP Au, Ag Lundin Gold 1,700
Lobo-Marte Chile Prefeasibility OP Au Kinross Gold 1,700
Kiaka Burkina Faso Feasibility OP Au B2Gold 1,610
Angostura Colombia Prefeasibility UG Au, Ag Eco Oro 1,529
Morelos (Media Luna) Mexico Prefeasibility OP Au Torex Gold 1,482
Tasiast Mauritania Operating, exp/feasib OP Au Kinross Gold 1,290
Copper
Andina Chile Operating, exp/constr OP, UG Cu, Mo Codelco 07,500
Resolution USA Prefeasibility UG Cu, Mo Rio Tinto, BHP Billiton 06,000
Collahuasi Chile Operating, exp/susp OP Cu Anglo American, Glencore, Mitsui, JX Nippon Mining 06,500
Cobre Panamá Panama Construction OP Cu, Au First Quantum 05,950
Tampakan Philippines Feasibility OP Cu, Au Indophil Resources 05,900
Quebrada Blanca Chile Operating, exp/constr OP Cu Teck 05,600
El Teniente Chile Operating, exp/constr UG Cu, Mo Codelco 05,400
Oyu Tolgoi Mongolia Operating, exp/feasib OP Cu, Au Rio Tinto, State of Mongolia 04,900
Wafi-Golpu Papua New Guinea Feasibility UG Cu, Au Harmony, Newcrest 04,845
Udokan Russia Prefeasibility OP Cu, Ag Metalloinvest 04,800
Pebble USA Prefeasibility OP Cu, Au Northern Dynasty 04,500
Chuquicamata Chile Operating, exp/feasib OP Cu, Mo Codelco 04,200
Cerro Verde Peru Operating, exp/plans OP Cu FMCG, SMM, Buenaventura 04,000
Los Azules Argentina Prefeasibility OP Cu, Au McEwen 03,900
Escondida Chile Operating, exp/constr OP Cu, Au BHP Billiton, Rio Tinto, Mitsubishi, 03,800
JX Nippon Mining, Mitsubishi Materials
Corridor Chile Feasibility OP Cu, Au Goldcorp, Teck 03,500
Quellaveco Peru Feasibility OP Cu, Mo Anglo American, Mitsubishi 03,300
Grasberg Indonesia Operating, exp/plans OP, UG Cu, Au FMCG 03,175
Schaft Creek Canada Feasibility OP Cu, Au Copper Fox, Teck 02,892
Mes Aynak Afghanistan Closed, reopen/feasib OP Cu MCC, Jiangxi Copper 02,890
CuMo USA Prefeasibility OP Cu, Mo American CuMo 02,800
La Granja Peru Prefeasibility OP Cu Rio Tinto 02,500
Galeno Peru Prefeasibility/susp OP Cu, Au Minmetals, Jiangxi Copper 02,500
Aktogay Kazakhstan Feasibility OP Cu, Au KAZ Minerals 02,300
Agua Rica Argentina Feasibility OP Cu, Au Yamana 02,200
Casino Canada Feasibility OP Cu, Au Casino Mining 02,150
El Pachón Argentina Feasibility OP Cu, Mo Glencore 01,900
Frieda River Papua New Guinea Feasibility OP Cu, Au PanAust, Highlands Pacific 01,700
Santo Domingo Chile Feasibility OP Cu, Fe Capstone, KORES 01,700
Kamoa D R Congo Feasibility OP Cu Ivanhoe Mines 01,400
Rosemont USA Feasibility OP Cu Hudbay 01,200
Iron Ore
Simandou Guinea Feasibility OP Fe Rio Tinto, Chinalco, IFC, Govt. 20,000
Vale (S11D) Brazil Operating, exp/constr OP Fe Vale 20,000
Lac Otelnuk Canada Feasibility OP Fe WISCO, Adriana 12,909
KeMag/LabMag Canada Feasibility OP Fe New Millennium, Tata Steel 07,800
Tonkolili Sierra Leone Operating, exp/plans OP Fe Shandong Iron and Steel 05,000
Mbalam-Nabeba Cameroon/Congo (B) Feasibility OP Fe Sundance Resources 04,686
Kalia Guinea Feasibility OP Fe Bellzone 04,300
Balmoral Australia Feasibility OP Fe Mineralogy, Australasian Resources 03,968
Jack Hills Australia Operating, exp OP Fe Mitsubishi 03,809
Extension Hill Australia Feasibility OP Fe Asia Iron Australia 03,053
Southdown Australia Feasibility OP Fe Grange Resources, Sojitz Corp 02,936
Hawsons Australia Prefeasibility OP Fe Carpentaria, BMG 02,900
Mount Stuart Australia Feasibility/susp OP Fe AMCI, Baosteel, Cullen 02,813
Zanaga Congo (B) Feasibility OP Fe Glencore, Zanaga Iron 02,200
Silvergrass Australia Construction/exp OP Fe Rio Tinto 01,000
Askaf Mauritania Feasibility/susp OP Fe Glencore 00,900
Project Name Location Status Type Products Owner Project Cost (US$M)
Nickel
Weda Bay Indonesia Feasibility OP Ni, Co State of France, Mitsubishi, PT Antam 4,000
Kalgoorlie Australia Feasibility OP Ni, Co Heron Resources 3,574
Marlborough/Gladstone Australia Feasibility OP Ni, Co Mineralogy 3,400
Mindoro Philippines Feasibility OP Ni, Co Intex 2,455
Wingellina Australia Feasibility OP Ni, Co Metals X 2,269
Mount Margaret Australia Feasibility OP Ni, Co Glencore 2,035
Honeymoon Well Australia Feasibility OP Ni, Co Norilsk Nickel 1,506
Goongarrie Australia Prefeasibility OP Ni, Co Heron Resources 1,443
Decar Canada Prefeasibility OP Ni, Fe First Point Minerals 1,384
Rönnbäcken Sweden Prefeasibility/susp OP Ni, Co NMG 1,260
Yerilla Australia Prefeasibility OP Ni, Co Heron Resources 1,200
Dumont Canada Feasibility OP Ni, Co Royal Nickel 1,200
Talnakhskoye Russia Operating, exp/plans OP, UG Ni, Cu Norilsk Nickel 1,000
Mindoro Stage 1 Philippines Feasibility OP Ni, Co Intex Resources 0,981
Nonoc Philippines Susp, restart/feasib OP Ni, Co Philnico 0,950
Mayaniquel Guatemala Prefeasibility OP Ni, Co Anfield Nickel 0,946
Eagle’s Nest Canada Feasibility UG Ni, Cu, PGE Noront 0,609
PGMs
Twickenham South Africa Operating, exp/plans UG Pt, Pd Anglo American 1,248
Sheba’s Ridge South Africa Feasibility OP Pt, Pd Aquarius, Anglo American, State of South Africa 0,972
Sedibelo West South Africa Feasibility OP Pt, Pd Pallinghurst Resources 0,700
Garatau South Africa Feasibility UG Pt, Pd Nkwe Platinum 0,659
Fedorova Tundra Russia Feasibility UG Pd, Pt Barrick 0,640
Project 1 South Africa Feasibility UG Pt, Pd PGM Ltd, JNMC, Anglo American 0,443
Arctic Platinum Finland Prefeasibility OP Pd, Pt Gold Fields 0,429
Silver
Konimansuri Kalon Tadjikistan Prefeasibility UG Ag, Pb State of Tajikistan 2,000
Hermosa USA Prefeasibility OP Ag Wildcat Silver 0,835
Navidad Argentina Prefeasibility OP Ag, Pb Pan American Silver 0,760
Brucejack Canada Feasibility UG Ag, Au Pretium Resources 0,747
Pitarrilla Mexico Feasibility OP, UG Ag Silver Standard 0,741
Corani Peru Feasibility OP Ag, Pb Bear Creek Mining 0,625
Diamonds
Venetia South Africa Operating, exp/constr UG Diamonds DBCM 2,100
Star Canada Prefeasibility OP Diamonds Shore Gold 1,939
Verkhotina (Grib) Russia Feasibility OP Diamonds Lukoil-Northwest 0,850
Renard Canada Construction OP, UG Diamonds Stornoway Diamonds 0,810
Cullinan South Africa Operating, exp UG Diamonds Petra Diamonds 0,632
Gahcho Kué Canada Construction OP Diamonds Anglo American, Mountain Province 0,556
Jwaneng Botswana Operating, exp/feasib OP Diamonds Anglo American, State of Botswana 0,500
Ekati Canada Operating, exp/plans OP, UG Diamonds Dominion Diamond 0,365
Liqhobong Lesotho Construction OP Diamonds Firestone Diamonds, State of Lesotho 0,185
Uranium/Rare Earths
Viken Sweden Prefeasibility OP U, V Continental Precious Minerals 2,010
Rössing So. (Husab) Namibia Feasibility OP U CGN-URC, CADFund 1,660
Kvanefjeld Greenland Feasibility OP U, REO Greenland Minerals & Energy 1,534
Khiagdinskoye Russia Operating, exp/plans ISL U Rosatom 1,119
Michelin Canada Prefeasibility OP, UG U Paladin Energy 0,994
Etango Namibia Feasibility OP U Bannerman Resources 0,870
Eco Ridge Canada Closed, reopen/plans UG U, REO Pele Mtn Resources 0,563
Norasa Namibia Feasibility OP U Forsys Metals 0,432
Browns Range Australia Feasibility OP, UG REO Northern Minerals 0,345
Wiluna Australia Prefeasibility OP U Toro Energy 0,241
Zinc
Admiral Bay Australia Prefeasibility UG Zn, Pb PLD Corp. 0,837
Dugald River Australia Feasibility UG Zn, Pb MMG Ltd. 0,750
Izok Corridor Canada Feasibility OP Zn, Cu MMG Ltd. 0,539
Terrazas Mexico Prefeasibility OP Zn, Cu War Eagle Mining 0,500
Hilarion Peru Prefeasibility UG Zn, Pb Votorantim 0,500
Asmara Eritrea Feasibility OP Zn, Cu Sunridge Gold, ENAMCO 0,489
Ironbark Greenland Feasibility UG Zn, Pb Ironbark, Nyrstar 0,484
Tala Hamza Algeria Feasibility UG Zn, Pb Terramin, ENOF 0,413
Hackett River Canada Prefeasibility/delayed OP, UG Zn, Ag Glencore 0,409
Tulsequah Chief Canada Feasibility/permits UG Zn, Ag Chieftain Metals 0,282
George Fisher North Australia Operating, exp UG Zn, Pb Glencore 0,252
Lombador Portugal Feasibility/permits UG Zn Lundin Mining 0,228
Yukon Canada Prefeasibility OP, UG Zn Overland Resources 0,227


