


Squeezed from several sides, politically, economically, and technologically, the world’s coal producers and users need to build a new framework for the future. E&MJ looks at some of the issues and how they can be addressed.
By Simon Walker, European Editor

A vital component of the highly volatile world energy market, coal producers and users alike are today facing unprecedented challenges from all sides.
After a slow start, the renewable energy-production sector appears to be building a head of steam, albeit still on a relatively localized basis. Coal usage remains a political football with respect to its effect on the global environment, while technological developments that could help to strengthen the coal lobby’s case remain frustratingly remote—mainly on account of their short-term investment implications. And, as a constituent of a multifaceted marketplace, coal producers have seen the value of their output slide persistently in recent years as price moves in other areas have dragged the entire sector down.
It is probably not really necessary to spell out the situation in detail, but for anyone who has been on a five-year sabbatical in a deep cave, maybe a précis will suffice. Since the middle of last year in particular, but with a recognizably longer lead-in, the world energy market in general has been subject to what can best be described as a price shock. Not, as the world has previously been accustomed, in an upward direction, but through the floor.
As discussed in detail in E&MJ’s annual review of the oil sands industry (August 2015, pp. 32–40), there has been no single driving force for the price decline that has seen the value of a barrel of oil cut by more than half over 12 months. Rather, there has been a coming-together of a raft of significant influences—political, environmental and economic—which, between them, have impacted oil prices.
And, of course, where oil prices go, those of other energy commodities are bound to follow. As shown in Table 1, coal is no exception, albeit with the proviso that the environmental effects of its use have already been under decades of scrutiny that have led to increasingly stringent technological restrictions being put into place for utility and industry consumers. What is more, these restrictions are now being introduced more widely across the coal-consuming world. Metallurgical coal producers have also seen their markets drop as demand for steel has slowed, especially in China.
On the bright side for consumers, by contrast, the international coal market has become, if anything, even more competitive than it has been for many years. U.S. producers in particular have re-entered the export business as their domestic customers have cut demand at home, with the excess being shipped overseas as a means of maintaining production volumes.
COAL IN A COMPETITIVE MARKET As the 2015 edition of the World Energy Council’s World Energy Issues Monitor put it: “Energy price volatility: the new normal.” In his foreword to the report, the organization’s secretary general, Christoph Frei, provided a concise overview of the current situation. “In the oil market, we are seeing the lowest prices in more than five years as a result of oversupply and weak demand (from Europe and China),” he wrote. “2015 has begun with oil prices below $50/barrel, significantly below the critical $70 mark seen as the ‘survival threshold’ for many high-end cost producers in the U.S. and Canada, as well as for the state budget of oil export dependent economies, including Nigeria, Mexico, Russia and Venezuela. 2014 may well be remembered for the start of a new ‘price war’ in which OPEC’s capacity to control prices has not materialized other than in voluntarily letting prices slip in order to let the market address competition.
“High volatility has become the new normal that energy leaders face and in which we expect them to take investment decisions at an unprecedented scale,” he stated.
Looking at long-term trends, Figure 1 shows how world coal production has grown over the past 20 years. With the exception of a minor dip in the late 1990s, around the time of the Asian financial crisis (remember that?), output has grown consistently year-on-year. Until 2014, that is, when a combination of factors led to a slight year-on-year fall in total coal production.
Among these, according to the International Energy Agency (IEA) in its Key Coal Trends summary publication, was the downturn in Chinese mined output in response to the economic slowdown there, lower production in Indonesia as the country’s exports to China fell, and the impact of the civil turmoil in eastern Ukraine, which cost the country more than 24 million metric tons (mt) of lost production.
In terms of quality, world coking coal production reached a new record of 1.06 billion mt last year, the IEA reported, whereas the output of both steam coal and lignite fell.
The dominance of the Asia-Pacific region in coal production is highlighted in Figure 2, which shows the production trends in the three major coal-producing regions of the world. The data can basically be interpreted as both North America and Europe/Eurasia having marked time over the past 20 years, while China, India, Indonesia and Australia have steamed ahead. That is not to say that there has been no significant change in individual countries’ production during this time, but rather that the long-term balance has been maintained on a regional basis.
Indeed, as Figure 3 shows, there have been some major increases in coal output aside from China’s. Between 1995 and 2014, Australian production nearly doubled, and India’s went up by 123%, while the increase in Russian output was more modest, at 32%, as the country rebuilt its economy following the demise of the Soviet Union and the subsequent financial meltdown. However, who in 1995 would have predicted Indonesian coal production to have grown tenfold by 2014?
Finally, Figure 4 provides a graphical interpretation of the national and regional contributions to world coal production last year. Major producing and exporting nations are shown individually, while the output from other countries has been combined to give regional totals. It should be noted that the percentages shown are based on BP’s reporting approach, as discussed below.

DATA SOURCES
The data used for the figures include hard coal (bituminous and anthracite), sub-bituminous, brown coal and lignite. In compiling these commercial production data, BP makes no distinction on a tonnage basis between the various coal qualities, or between thermal and metallurgical coal. For that, one has to turn to the 2015 edition of the IEA’s Coal Information, which is published later in the year but has a closer focus on coal in particular, rather than treating it as a component of the wider energy commodity mix.
There are, of course, some inconsistencies between the data presented by BP and the IEA, which predominantly relate to the accuracy and method of reporting adopted by individual coal-producing, coal-exporting and coal-consuming countries. Thus, for example, BP believes that Chinese production of all grades of coal totaled 3.87 billion mt last year. The IEA, on the other hand, presents a more conservative figure of 3.75 billion mt; where both organizations agree is that China produced close to 100 million mt less in 2014 than it did in 2013.
There is also a discrepancy in the producers’ league table for 2014, with BP listing Indonesia in fourth place, ahead of Australia, despite their respective outputs of 458 million mt and 491.5 million mt. The IEA begs to differ, listing Australia ahead of Indonesia. The explanation centers on BP’s method of converting coal tonnages into metric tons of oil equivalent when it comes to ranking countries’ output. Because Australia’s total includes some 60 million mt of lignite, which has a lower energy content and hence is equivalent to a smaller volume of oil, on this basis, Australia produced less energy in its coal than Indonesia did last year.
Hence BP’s rationale for listing Indonesia as the world’s fourth-largest coal producer, and Australia fifth—a viewpoint that certainly has some merit in terms of making comparisons within the wider energy market, but can be somewhat misleading when it comes to real tons coming through the mine gate.
CHINA’S ECONOMIC IMPACT
China has been the world’s leading coal producer since 1985, with little prospect of it losing that status since its output is so far ahead of any other country. Nonetheless, the uncertainties that have affected the world energy market since 2008 have finally begun to have an impact on China as well, such that its energy demand growth has been slowing in response to both political and wider economic influences. The impact of the Chinese government’s decision in mid-August to devalue the country’s currency, albeit in a limited way, has yet to be evaluated properly, so it is too early to tell whether it will help to boost energy demand again—and hence the need to mine (or import) more coal.
Conversely, the initial devaluation may only be a first step if the government decides that more is needed. Opinion remains divided as to whether this is an indication that the Chinese domestic economy is actually significantly weaker than outward indications would suggest, or whether the government is concerned that its attempt to redirect the economy away from cheap exports of consumer goods and toward higher national demand is not gaining sufficient ground. If it turns out that economic growth continues to slow, then the impact could indeed be widespread, especially if Chinese demand for raw materials weakens as well.
If this were to be the case, then not only would Australia feel the fallout, but so would developing-economy countries such as Indonesia, Russia and South Africa. All of them export commodities—including coal—to China, so any reduction in demand there will undoubtedly have a significant knock-on effect on their economies.
In point of fact, concern in Australia is already growing, given the country’s reliance on Chinese markets for its coal and iron ore, with weak commodity prices affecting government revenues as well as mineral-producer profitability. In an article published in the U.K. Daily Telegraph in July, commodities columnist Andrew Critchlow highlighted the recent move by Hancock Prospecting to introduce a 10% pay cut for most of the workforce at its Roy Hill iron-ore mine. However, the company noted at the time that this decision had been made after a workforce survey had shown majority approval for the cut in return for maintaining family-friendly working rosters.
Where iron ore goes, so coal may well follow, with Critchlow pointing out that lower commodity prices have increased Australia’s world trade deficit, and forced the government to borrow more. “Could a prolonged period of depressed commodity prices even turn Australia into Asia’s version of Greece,” Critchlow asked, “with China being its banker of last resort instead of the European Union?”
THE WORLD’S COAL TRADE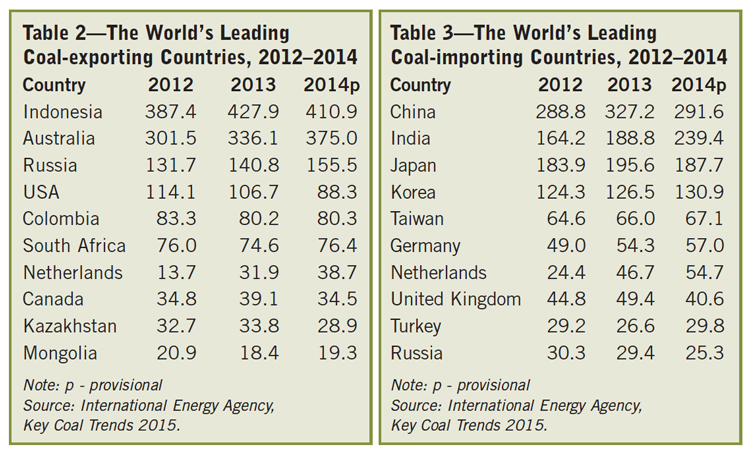 In the 2015 edition of its Key Coal Trends publication, the IEA reported that the export trade of all types of coal in the world reached a record level of 1.38 billion mt last year, a 0.7% increase over 2013. Of this, 1.05 billion mt comprised steam coal, with a further 321.8 million mt of coking coal. Lignite exports added just 8 million mt to the total, emphasizing its predominant use in mine-mouth or at least domestic markets within the country of production. Seaborne trade accounted for 1.23 billion mt of the total.
Once again, some discrepancies creep in, largely as a result of different reporting criteria from country to country. As the IEA pointed out, “Australia includes some types of coal (soft or semi-soft coking coal, used for blending or as PCI) in its coking coal statistics; however, other countries may include this trade in their steam coal import statistics.” There are also variations between countries that report data on a calendar basis, and those—such as Australia, India and Japan—where fiscal-year reporting is the norm. This can lead to what sometimes appears to be “double-counting” in terms of imports and non-reporting for exports: thus, the organization’s data show that taken on an import basis, the world’s coal trade was actually some 40 million mt higher than the export data cited above would suggest.
One clear trend, however, is that the world coal trade has been growing at a faster rate than consumption for many years. Between 1971 and 2014, world primary energy supply for steam and coking coal combined grew by 301%. In the same period, exports grew by 844%, with international trade reaching a record 23.1% of total consumption last year, up from 11.1% in 1980.
In terms of coal exports, as shown in Table 2, Indonesia remained the world leader last year, with a total of 410.9 million mt. This was, however, some 17 million mt lower than in 2013 while the second-placed exporter, Australia, closed the gap somewhat by increasing its exports from 336.1 to 375 million mt on a fiscal year basis.
Where imports are concerned, as Table 3 shows, China remains by far the largest consumer of other countries’ coal, although its imports fell by nearly 11% between 2013 and 2014. Exporting countries that suffered sales losses as a result included Indonesia, South Africa, Vietnam and the USA. For the first time ever, imports in the Asia-Oceania region topped 1 billion mt.
The inclusion of The Netherlands in the export table is, as the IEA acknowledged, somewhat surprising, given that it no longer has a domestic coal industry. However, its ports offer major transshipment facilities for the rest of western Europe, with the country’s government now reporting both export and import data separately.
 The world’s top five coal-exporting countries are listed in Table 4. On a regional basis, the principal steam-coal suppliers to Asia-Oceania were Indonesia, Australia, the Russian Federation, South Africa, Mongolia and the USA. For Europe and Eurasia, the main suppliers were Russia, Colombia, the USA, Kazakhstan and South Africa, while the USA drew imports from Colombia and Canada.
Turning to coking coal, Australia is by far and away the world’s largest exporter (See Table 5), having increased its shipments in the fiscal period between July 2013 and June 2014 by 26.5 million mt to 182 million mt. Overall, world coking-coal trade increased by nearly 9% last year to reach 321.8 million mt. China, India, Japan, Korea and Brazil were the main export destinations worldwide. Australia accounted for more than two-thirds of the coking coal imported into the Asia-Oceania region, followed by Canada, Mongolia, Russia and the USA. Europe’s steelmakers acquired their coking coal predominantly from suppliers in the USA, Australia and Russia, with Brazil’s supplies coming from the USA, Australia and Canada.
The emergence of Mongolia as a significant supplier of coking coal, mainly to China, is an indication of the way in which the country’s government has been able to oversee the development of its natural resources in the relatively recent past. This contrasts with Mozambique, where the pot seems to have gone off the boil as far as coking-coal projects are concerned.
Writing earlier this year, Reuters’ columnist Clyde Russell looked at the implications of Mongolia’s new-found China trade. “Chinese customs data showed that for February, the cost of coking coal from Mongolia was A$40.45 a metric ton, compared to A$110.04 for Australian cargoes,” he noted.
“While Mongolian coal does present more challenges in transport, given that it has to use a combination of trucks and rail, this sort of price differential makes it very appealing to steel mills, most of whom are battling low profitability,” he went on.
In July, meanwhile, Reuters’ reporter Ed Stoddard looked at why Mozambique’s coal-development program seems to have stalled, citing “low prices, overblown expectations, and a rail and port network that remains woefully inadequate.” In addition, the government is now focusing more on offshore natural gas. “At this stage, Mozambique is not a coal story any more. It’s very expensive, very uncompetitive and they need a lot of added capacity,” he quoted a regional economist as saying. “It’s really a liquefied natural gas story now and I think the government is shifting its focus from coal to LNG,” his source added.
As it stands, only Vale has successfully commissioned a realistic coking-coal project in the country since the flurry of activity began, with Rio Tinto having sold its interests there for a pittance at the end of last year. Mozambique exported 3.8 million mt of coking coal last year, according to the IEA, but is hamstrung by a railway infrastructure that can handle no more than 6 million mt/y, Stoddard noted.

Coal from Peabody’s Wilpinjong and Wambo mines in New South Wales was the first to arrive at the newly constructed Newcastle Coal Infrastructure Group export terminal in Australia.
INDIA’S OUTPUT GROWS MORE
Reflecting the country’s burgeoning energy demand, Coal India increased its production by a record 6.9% during fiscal 2104–2015, reaching an output of 494.2 million mt. Of this, 443.7 million mt was thermal coal, with 50.6 million mt of various types of coking coal. Power-station coal sales reached 384.2 million mt.
Most of Coal India’s non-coking coal comes from mines in the Korba, Singrauli, Talcher, IB Valley and Wardha Valley coalfields, while the company sources most of its coking coal from the Jharia coalfield. Its operating subsidiaries opened three new open-cast mining complexes during the year: Magadh and Konar (Central Coalfields); Makardhokra 1, Bhanegaon and Panganga (Western Coalfields); and Jampali (South Eastern Coalfields).
In China, meanwhile, Shenhua Energy’s production of 306.6 million mt was slightly down on 2013, while coal sales of 451 million mt were 12% lower. The company’s two main mining complexes, Shendong and Zhunge’er, produced 187.8 and 61.8 million mt, respectively.
Shenhua’s main development projects in China are the Guojiawan and Qinglongsi mines, while it is progressing its Watermark project in New South Wales. Other international projects include Tsankhi (Tavan Tolgoi) in Mongolia, a Sino-Mongolian railway and Zashulanskoye in Russia.
Peabody maintained its position as the world’s largest private-sector coal producer with sales of 226.7 million mt in 2014, of which 208.3 million mt were from its own operations in the United States and Australia. Its western U.S. mines contributed 151 million mt to this total, with a further 22.7 million mt from the Midwest, and 34.7 million mt from Australia—of which 16 million mt was coking coal.
The company reported that it increased its southern Powder River Basin output to the highest annual level since 2011, with its flagship North Antelope Rochelle mine achieving record production despite rail-shipment issues.
Peabody’s leading U.S.-based competitor, Arch Coal, increased its own output from 116.7 million mt in 2013 to 120.1 million mt last year, of which 91.8 million mt was sourced from its Black Thunder mine in Wyoming. The company increased its coking coal output during the year as its new 3.2-million-mt/y Leer longwall mine ramped up capacity, but sold its Hazard mine complex during the year and idled operations at Cumberland River.
THE INTERNATIONAL PLAYERS
Anglo American increased output at its Australian and Canadian mines during 2014, producing 20.9 million mt of coking coal and 12.3 million mt of thermal coal for both the export and domestic markets. In South Africa, the company’s operations produced 55.7 million mt of thermal coal, of which 31 million mt were sold to the state utility, Eskom. Anglo’s one-third share in the Cerrejón operations in Colombia contributed a further 11.2 million mt to its output total. The company’s largest individual producers in Australia were Capcoal (7.6 million mt) and Callide (7.5 million mt), while New Vaal in South Africa produced 16.7 million mt of power-station fuel.
Anglo put its Peace River coking-coal operation in Canada on care-and-maintenance at the end of last year. For the first half of 2015, the company’s coal output was 1% down on the same period in 2014, mainly reflecting lower coking-coal output in Australia and lower thermal coal supplies to Eskom.
Having sold its interest in the Clermont thermal coal mine in Australia during the year, and its Mozambique projects, Rio Tinto reported lower production in 2014 than in the previous year. Hard coking coal output of 7.5 million mt was 9% down, semi-soft coking coal was 3.2 million mt (-17%) and thermal coal was 21.9 million mt (-5%). The company’s annual report pointed out that production records at Hail Creek, Hunter Valley Operations and Bengalla, driven by significant productivity gains, cost improvements and benefits from a weaker Australian dollar, were more than offset by lower prices.
Rio Tinto launched its Hunter Blend project late last year, which aims to enable it to operate its Hunter Valley coal mines, plants and logistics infrastructure as one integrated system. It is also evaluating future plans for its 30-year-old Warkworth mine in the district, as well as progressing the 8.5-million-mt/y Mount Pleasant deposit there.
Rio Tinto and Glencore reportedly discussed combining their Hunter Valley operations last year, although the talks led nowhere at the time. More recently, however, the two companies are understood to have resumed negotiations, this time over a direct sale of Rio Tinto’s New South Wales operations to Glencore. To make the picture more complicated, former Xstrata CEO Mick Davies’ new investment vehicle, X2 Resources, is also believed to be interested in buying the mines, which have a reported $3 billion price tag.
Glencore itself reported a 6% increase in total coal production during 2014, at 146.3 million mt, the increase being related to productivity improvements and the delivery of various advanced stage Australian thermal-coal projects. The company shut down its Australian coal operations for three weeks during December 2014 and January 2015 in response to weak markets, and has announced a 15 million mt production cut this year.
Its Australian operations contributed 9.5 million mt of coking and semi-soft coal, markedly down year-on-year, with 60 million mt of thermal coal—54.5 million mt of which was exported. In South Africa, the company produced 46.1 million mt, split almost equally between export and domestic sales, while its interests in Colombia added 19.5 million mt from Prodeco and 11.2 million mt from Cerrejón.
In early August, Glencore announced a rescue package for its Optimum mine in South Africa, which has been loss-making under its existing Eskom supply contract. The proposed scheme includes reducing capacity at the mine by around 5 million mt/y with the suspension of open-cast mining.
Despite rising concerns over the coking coal market, BHP Billiton increased its output from its Queensland mines to 49 million mt in 2014, with a further 72 million mt of thermal coal. South Africa remained its main thermal-coal producer, at 31.5 million mt, with 19.5 million mt from Australia, 10 million mt from New Mexico and 11 million mt from Cerrejón.
Having sold its Navajo mine in New Mexico in 2013, BHPB completed the sale of its San Juan mine in the state in July. The company opened the new 5.5-million-mt/y Caval Ridge coking-coal operation in Queensland last October, with former coal President Dean Della Valle stating that it will be “one of the most productive, sustainable and highly performing metallurgical coal mines in the world.”
In mid-August, BHPB brought in contractors to take over drilling and prestripping at its Blackwater mine in Queensland, cutting a fifth of its own workforce in the process. Its current coal operations president, Mike Harvey, noted that the “dire conditions in the metallurgical coal market could get more challenging before they get better,” given the current 25-35 million mt of oversupply capacity for coking coal.
US AND CHINESE POLICY
Ahead of the next round of climate change talks, scheduled to take place in Paris in December, both of the world’s largest carbon emitters have tabled proposals for emission reductions. In June, the Chinese government announced its intention to cut greenhouse gas emissions per unit of gross domestic product by 60%–65% from 2005 levels. The country also announced plans to source about 20% of its primary energy consumption from non-fossil fuels by 2030, when its carbon emissions are predicted to peak.
The announcement followed the joint agreement between China and the U.S. last November, in which both countries pledged to cut their emissions. At the time, the White House noted the scale of investment that China will need to make in order to achieve its aims. “It will require China to deploy an additional 800-1,000 GW of nuclear, wind, solar and other zero-emission generation capacity by 2030—more than all the coal-fired power plants that exist in China today,” its statement read.
The U.S. followed China’s lead in early August with the release of President Obama’s latest proposals for reducing carbon emissions. In essence, these include a 32% cut in carbon emissions from power plants by 2030 from 2005 levels (with 15% already achieved), with renewables then contributing 28% of primary power generation.
However, as a recent article by Amitabh Sinha in The Indian Express pointed out, “the significance of Obama’s plan lies elsewhere [than the USA]—and holds an important lesson for countries like India, which are much more dependent on coal than the U.S. for producing electricity.
“Obama’s plan is trying to ensure that coal in the U.S. becomes and remains clean for the time that it is around,” the article went on. “It is a message that needs to reverberate across other coal-dependent countries, mainly India and China, who have some of the dirtiest coal power plants.
“More than 60% of India’s power is produced in coal-fired plants. Despite the planned massive boost to solar and wind energy, absolute consumption is only going to increase as India tries to lift power generation 3.5-4 times in the next 20 years. The need for ‘cleaning’ coal is therefore obvious—and of utmost importance in meeting India’s climate objectives,” Sinha stated.
Yet is all as it seems? A study recently published in Nature suggests that China’s power-station per-fuel-ton carbon emissions may not be as high as has previously been estimated, since much of the coal burnt is unwashed and has a lower carbon content than the internationally accepted averages used for the calculations. If this were the case, the study’s authors suggest, then in 2013 global carbon emissions could have been as much as 10% lower than had been believed.
The researchers reportedly studied the actual carbon content from numerous Chinese mines, and determined that the emission factors averaged about 40% lower than the default values used by the International Panel on Climate Change and other organizations in their estimations. Not surprisingly, the interpretation has been called into question by others in the field, although there is overall agreement that improved emissions data reporting throughout the developing world can only be a good thing.
COAL’S CHALLENGES
From the producers’ perspective, the good news is that coal is not going to go away any time soon—its value as a reliable energy source is just too great. However, and it is a big “however,” there is no question that the pressures on coal and its producers are here for the long haul, which means that those same producers are going to have to do their job even more efficiently and cost-effectively than ever before.
And they know it. Speaking in May to the Australian Financial Review, the new head of Rio Tinto’s coal and copper business, Jean-Sébastien Jacques, said that he expected that it will take three to four years before there is “a light at the end of the tunnel” for thermal coal prices. In the meantime, the company and its competitors are all focusing on cutting costs and improving productivity in a bid to keep each of their mines viable.
Finding funding for new projects or replacement capacity may also become more challenging. Companies with exposure to mineral commodities have been hard-hit in recent weeks as investor sentiment has weakened. Between the beginning of June and mid-August, Rio Tinto’s share price lost 17.5%, and BHPB fell by 22%. And Glencore? Minus 44%, all of which mean that companies such as these will find future financing more expensive, especially in an environment where some traditional funding sources, such as Norway’s sovereign wealth fund, have committed to withdraw from coal-sector investment.
The global energy market is changing, and changing fast, with coal emerging as the commodity under greatest price pressure. As the World Energy Council’s Christoph Frei noted, “This changing energy map—with the global energy demand center shifting from OECD to Asia—has profound regional and geo-strategic implications, [while] political and regulatory risk is still the key concern for investors in energy.”
The world coal market will certainly survive, although the fundamentals maybe different. Jacques looked on the bright side when he said, “There is no doubt that the world needs more energy, and a big chunk of it will come from thermal coal.”


