


Recent producer cutbacks led to rising prices for both metals last year. E&MJ looks at whether this progress can be maintained.
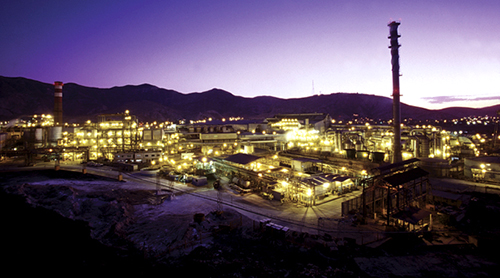
The Metalurgica Met-Mex Penoles plant in Torreon, Mexico, which incorporates 180,000 mt/y of lead smelting and refining capacity, and a 240,000-mt/y zinc refinery.
Metal prices on the London Metal Exchange (LME) generally trended higher during 2016, although for some commodities — such as aluminum — there was a significant level of fluctuation within the overall upward movement. Zinc, however, kept the momentum going, at least for most of the year, with the three-month price in November reaching levels not seen since the beginning of 2010. Lead followed suit to some extent, although its November maximum still fell short of top prices seen over the past six years.
The reason for zinc having been the top performer on the LME in 2016 was fairly straightforward to see: mine supply was down year-on-year and with usage higher, smelters ended up having to pay more for their feed. Data from the International Lead and Zinc Study Group (ILZSG), covering the first 10 months of the year, showed that mine supply between January and October 2016 was 10.887 million metric tons (mt), compared to 11.092 million mt in the corresponding period of 2015.
At 11.322 million mt, refined metal production for the 10 months was only fractionally lower than in 2015, while metal usage rose year-on-year from 11.184 million to 11.599 million mt.
For the full year, last October, the ILZSG predicted global demand for refined zinc metal to rise by a marginal 0.6% to 13.57 million mt in 2016 followed by a 2.1% increase to 13.85 million mt in 2017. On the supply side, the organization’s view at that time was that world zinc mine production will have fallen by 5.6% to 12.47 million mt in 2016. Taking Chinese production out of these data, the ILZSG expected mine supply to have fallen by 11.7% last year, equivalent to almost 1 million mt of contained zinc. Its prediction for 2017 is that global output will recover by 5.9% to 13.20 million mt.
Figure 1 shows mined zinc production trends since 1999, using historical data from the British Geological Survey and — for 2015 and 2016 — the ILZSG. As can be seen, growth in mined output was essentially steady until 2014, since when reserve depletion at two significant deposits and production cutbacks elsewhere in response to low commodity prices have taken their toll.
Turning to lead, ILZSG data for the January-October period show that newly mined output was nearly 8% down year-on-year, at 3.71 million mt. Refined production — which includes recycled and other secondary feed — was marginally lower at 8.89 million mt compared to 8.99 million mt in the comparable period in 2015, while metal usage was also
lower, having fallen from 9 million to 8.85 million mt.


