


In the fourth segment of this six-part series, the author explains how improving the quality of key information can lead to more effective decision-making and better overall control
By Paul D. Tomlingson
The information system is the shared communications network that controls execution of the mine’s maintenance program and other essential activities such as inventory control, purchasing or mining operations. A common integrated system implies cooperative use and interchange of information to control actions, communicate between departments and provide reports to management. Once system selection and implementation are accomplished, effective system utilization can contribute directly to effective maintenance.
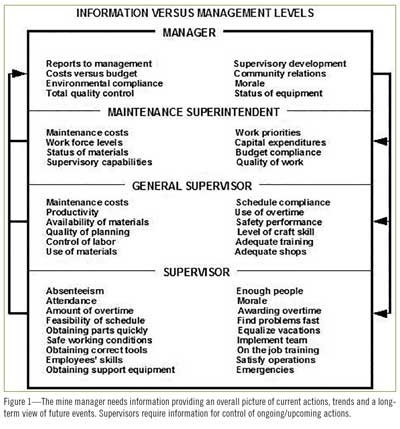
Utilizing Information Systems—Just as maintenance program definition influences information system selection and implementation, information utilization must also mirror the application of essential information identified, defined and verified in the maintenance program. Matching information needs with the requirements for actions required of key personnel is a necessary first step (Figure 1).
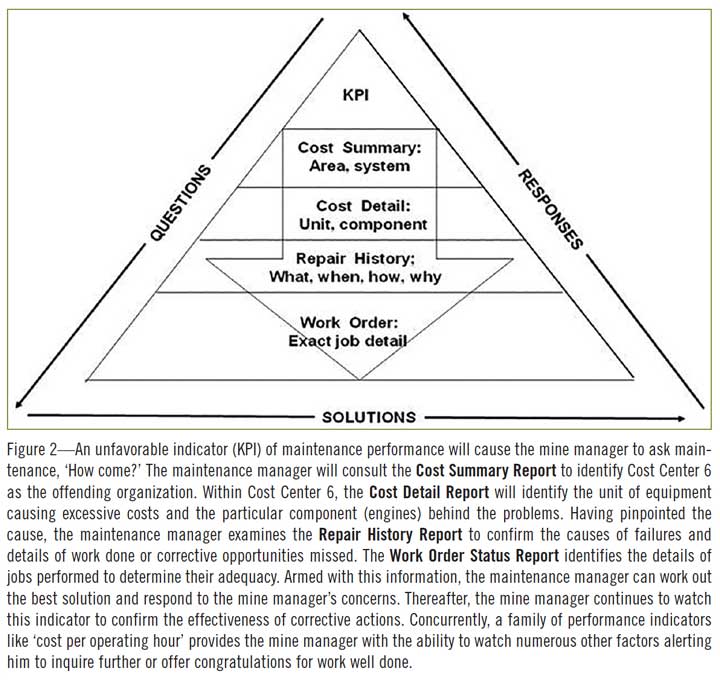
 Conceptualize Information Use—Information needs of key personnel are best illustrated with a concept tracing how management-level indices are utilized to trigger maintenance information responses that identify the nature of problems, devise corrective actions and respond to management concerns (Figure 2).
Essential Information—Definition of the maintenance program should have identified what information is required, how it should be developed, presented, to whom and what responses or actions will be required. There are two categories of maintenance information. Decision-making information is used to manage the overall maintenance effort, whereas administrative information is used to help control internal maintenance functions like absenteeism or overtime. Decision-making information includes: Control of Labor, Backlog, Work Status, Cost, Repair History, and selected Performance Indices, such as worker productivity or schedule compliance.
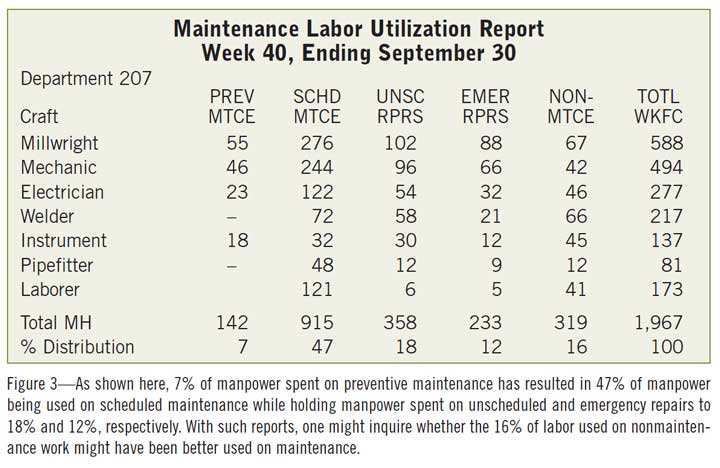
Control of Labor—The maintenance workforce exists essentially to install materials in the act of making repairs. But the only way that maintenance can control the cost of work they do is the efficiency with which they install materials. The efficient use of labor by category of work is an excellent barometer of the quality of labor control. When adequate man-hours are spent on preventive maintenance, for example, the result is a reduction in labor used on emergency and unscheduled repairs and an increase in labor used on planned and scheduled maintenance (Figure 3).
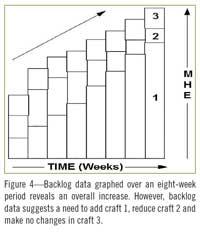
Backlog—The backlog is the number of estimated man-hours by craft required to complete all identified, though incomplete planned and scheduled work. It is an index of the degree to which maintenance is keeping up with the generation of work as well as a means of determining the proper size and craft composition of the workforce.
When the backlog is expressed in estimated man-hours by craft it has specific meaning in helping to adjust the workforce size and craft composition. For example, a rising backlog indicates too few personnel. An unchanged backlog indicates there are enough personnel and a falling backlog indicates a possible excess of personnel for the particular craft. The rising backlog means that more work is being generated than the craft can do. If the rise is long term, more personnel may have to be added. If the rise is shallow and uneven, the use of overtime or the help of a contractor could control it (Figure 4).
 The backlog is based on the compilation of man-hours associated with planned work. When a work order is opened, the estimated man-hours are added to the backlog. As actual man-hours are worked, the backlog is reduced. When the work order is closed, any remaining estimated man-hours are canceled. Backlog information permits the user to see the changes from the start of the week (STWK) through the end of the week (NDWK) for all crafts. Priorities are shown to indicate the backlog distribution by importance of work. There is no magic concerning the proper backlog level. The only way to determine the backlog level suitable for a particular operation is to first establish a means of measuring it and then, when maintenance is optimized, measure it. This step confirms the sustainable level of the backlog. This would represent the desirable backlog level by craft and it should be established as the target (Figure 5).
Work Status—Major planned and scheduled maintenance jobs are managed from inception to completion and, upon completion, cost and performance are isolated to assess work quality, resource use and costs. These jobs are drawn from the backlog and as the time approaches when they must be done, planners identify resources needed. Material availability and equipment condition determine when the work must be completed and its priority. Priorities influence labor allocation. Planners assemble groups of work orders to constitute a proposed plan for negotiation with operations and completion during the following week. Upon joint schedule approval, operations makes equipment available and maintenance performs the work.


As jobs are being carried out, planners may assess progress. Upon work completion, planners verify resource use; supervisors assess work quality, resource use and costs. Subsequently, schedule compliance is determined and managers informed. When the supervisor signals the planner that the work is completed, the work order is closed. Then, cost and performance are summarized and appropriate information is transferred to cost reports and repair history (Figure 6).
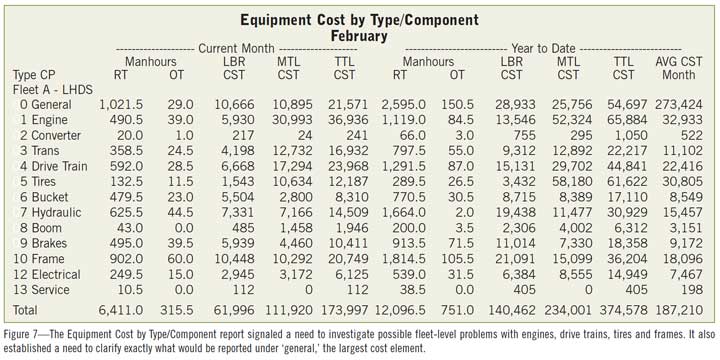
Cost—Cost information exists at two levels. A cost summary provides comparison of actual versus budgeted cost by cost center for all maintenance activities. Cost detail summarizes the cost of units and their components on a month- and year-to-date basis. Cost detail provides insight into troublesome details to be confirmed with repair history. Verification of improved equipment performance can also be confirmed. Comparisons of similar equipment help determine how well groups or fleets of equipment are performing. Cost reports must provide sufficient detail so that troublesome, costly components can be spotted, observed further and proper corrective actions can be taken (Figure 7).
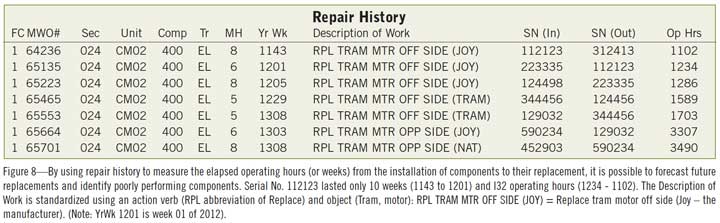
Repair History—Repair history allows the observation of chronic repetitive problems, confirmation of failure modes, observation of failure trends, determination of failure frequencies, observation of corrective actions taken, determination of whether the problem was corrected, measurement of component life spans, and the capability to develop corrective solutions and observe their results. Repair history should be separated from cost history as repair history describes what was done while cost history is what you spent doing it.
Repair history also plays a major role in forecasting the timing of the replacement of major components. It identifies the MTBF (mean time before failure) to establish the expected life spans of critical components. This information helps to forecast the next replacement of the component and such work often represents a significant portion of planned and scheduled maintenance (Figure 8).
Performance Indices—The information needed by the mine manager versus the maintenance manager differs in both nature and purpose. The mine manager, for example, needs summaries and trend information that tell him the mine is headed in a safe direction. Yet, his time must be divided among a multitude of interests and concerns. Thus, he has little time to study reports. But, he must be well informed. Consequently, he has the greatest need for indices that give him a comprehensive performance picture quickly. By contrast, supervisors want immediate information. They must know what happened on the previous shift and what new problems were created. He has less interest in trends and summaries.
Selection and development of a family of performance indices that best portray an overall maintenance performance picture must consider which indices best describe actual maintenance performance and how well data to support these indices can be developed. The most useful indices should appreciate the forces that drive maintenance costs. Consider the following factors:
- Total maintenance costs are controlled by the cost of materials used rather than by the cost of labor. Most maintenance departments have a stable workforce, total labor cost variations are largely due to overtime.
- Maintenance costs are determined by the volume of equipment maintained and the speed at which equipment repair consumes spare parts and materials. Thus, equipment repairs characterized by repeated emergencies consume materials faster than equipment subjected to a deliberate, well-ordered maintenance program. Therefore, a key maintenance cost reduction objective should be to reduce emergency repairs to slow the rate at which materials are consumed.
- Labor costs are incurred by the need to install materials. But, because emergency repairs are done less productively, more labor is consumed to install the same materials. The work is often rushed, resulting in lower work quality. Often, emergency repairs are done simply to get the equipment running again.
- The only significant control that maintenance has over the cost of the work they perform is the efficiency with which they install materials. Thus, better preventive maintenance, leading to fewer emergencies and more planning, results in better labor use and less labor cost to install the materials.
- As work is carried out, maintenance exercises better control over individual jobs that are planned and scheduled. These jobs, because they are better organized, are often completed in less elapsed downtime, reducing the overall cost because less labor is used.
- Maintenance supervisors make the greatest contribution to cost control through the productivity increases they bring about with quality supervision.
These factors make labor control a vital maintenance function and inclusion in performance indices. However, a close relationship also exists between operating costs, major repairs, and total maintenance costs. This requires a broader spectrum of indices to gain an overall picture of maintenance performance. In developing these indices, it is better to focus on the basics that ensure better performance than to identify a poor performance but not know how to improve it.
It is better, for example, to check for compliance with the PM program than to measure productivity. If PM services are done on time, it will permit more planned work and ensure better productivity, thus eliminating the need to check short time productivity.
Measuring performance of a single major job is not particularly useful. Likewise, total maintenance downtime is rarely useful. For example, downtime waiting for maintenance measures the effectiveness of maintenance communications. Downtime performing work reveals the efficiency of planning and control, downtime waiting for materials states the quality of material control support. Mechanical downtime versus of electrical downtime is void of any useful information.
Linkage of Indices—Many indices are interrelated. If, for instance, the maintenance supervisor spends little time on effective supervision, productivity will be poor.
The maintenance manager, on the other hand, is interested in the actual performance of his department. Thus, his need for performance indices, enabling him to identify the supervisor responsible for improving them. In turn, that supervisor must be able to pinpoint and correct the problem using available information. The maintenance manager, therefore, should focus on broad, direct areas that concern labor control:
- Productivity;
- Percent of labor used on emergency repairs;
- Percent of labor used, planned maintenance;
- Backlog level;
- Percentage of overtime;
- Compliance with the vacation schedule; and
- Compliance with absentee policies.
In summary, quality information impacts performance to gain better control with effective decision-making. Although information systems have made strides toward better data handling, maintenance personnel must take greater advantage of better information capabilities available. Performance indices when tied to information specifics ensure that corrective measures can be quickly identified and applied. The more attention given to the need for and the application of information during program development and documentation, the better will be the use of information in program execution.
Next month: Step 5—How to properly organize a maintenance department.
Paul D. Tomlingson (pdtmtc@msn.com) is a Denver-based maintenance management consultant. These articles are based on his book: Maintenance in Transition-The Journey to world Class Maintenance. Readers can obtain information on the book from the author, and may request an electronic copy of any one chapter or appendix as a professional courtesy.


