


By Steve Fiscor, Editor-in-Chief
There is an old expression that says “sell in May and go away.” Gold investors either got a head start in April or the worst is yet to come. Gold did manage to claw back half of its April losses by the end of the month. On May 1, gold prices closed at $1,458.10/oz. As a point of reference, E&MJ’s Price Index in the April edition listed the gold price as $1,595.80/oz (March 28, 2013). Month-to-month, that was a $137.70/oz loss (or 8.6%), but there is much more to the story.
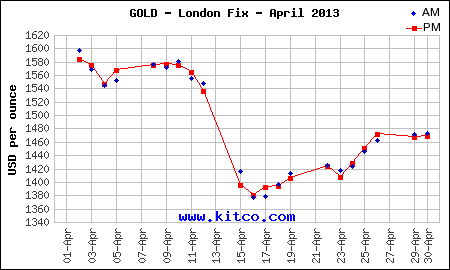 Looking at the market from a half-full perspective, gold prices are up 7.8% from the 26-month low the markets witnessed during mid-April. On April 15, gold closed at $1,352.60. On both April 12 and April 15, gold prices fell 13%.
Analysts have credited the partial bounce back to bullion and jewelry purchases in India and China. Similar to many religious cultures in the northern hemisphere, May is also the peak for Hindu weddings, where gold is often purchased for brides. Physical gold buying has been high during this period of soft prices, but it hasn’t been high enough to offset investor selling exchange traded funds (ETFs).
The gold held by ETFs declined sharply as investors sold shares. Similarly, indicators with sales activities regarding futures contracts are signaling that investor interest is cooling. With all of the ETF gold coming onto the market, gold investors are worried about an overhung market. As of April 26, ETFs held 73.4 million oz of gold, which was down more than 5% since the two-day mid-month plunge in prices and more than 13% since the beginning of the year.
Meanwhile, treasuries are reporting record gold coin sales in the U.S., Canada, Great Britain and Australia. Analysts attribute this divergent demand trend to the difference between individual investors who buy and hold gold as opposed to large hedge funds that are liquidating positions in the gold ETFs.
E&MJ PRICES INDEX
(May 1, 2013)
| Precious Metals ($/oz) | Base Metals ($/mt) | Minor Metals ($/mt) | Exchange Rates (U.S.$ Equivalent) | ||||
| Gold | $1,458.10 | Aluminum | $1,788.50 | Molybdenum | $25,000 | Euro (€) | 1.3186 |
| Silver | $23.65 | Copper | $6,875.00 | Cobalt | $27,600 | U.K. (£) | 1.5557 |
| Platinum | $1,482.00 | Lead | $1,970.00 | Canada ($) | 0.9930 | ||
| Palladium | $688.00 | Nickel | $14,975.00 | Iron Ore ($/dmt) | Australia ($) | 1.0338 | |
| Rhodium | $1,150.00 | Tin | $19,775.00 | Fe CFR China | $133.75 | South Africa (Rand) | 0.1112 |
| Ruthenium | $85.00 | Zinc | $1,803.50 | China (¥) | 0.1611 | ||
Gold and silver prices provided by KITCO Bullion dealers (http://www.kitco.com). Platinum group metals prices provided by Johnson Matthey (http://www.platinum.matthey.com).
|
|||||||


