By Steve Fiscor, Editor-in-Chief
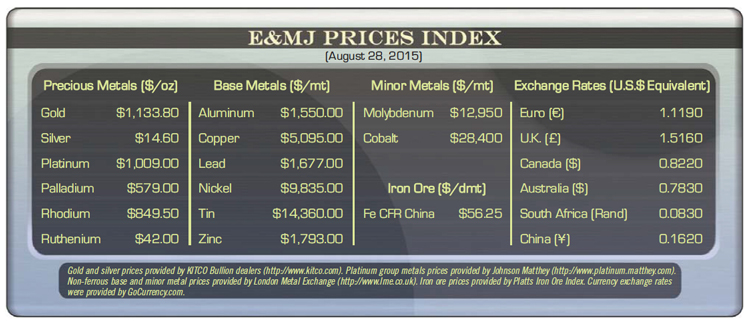
Gold moved higher from $1,088/oz to nearly $1,134/oz during August as investors sought relief from a global slump in stock prices. The Dow Jones Industrial Average swung back and forth more than 1,000 points before settling down 6% for the month. The market activity, brought about as oil declined below $40/barrel (bbl) and the Chinese devalued its currency, could cause the U.S. Federal Reserve to rethink a hike in interest rates.
 Market analysts believe the rate hike decision has placed a cap on gold prices. Any delay to a rate increase would benefit gold. During the last few trading days in August, oil rallied to $45/bbl, which offered more support to gold.
Inversely, copper prices finished slightly lower. During August, copper dropped from $2.38/lb to $2.32/lb. Weaker-than-expected demand, a strengthening U.S. dollar, and lower oil prices influenced copper prices.
According to International Copper Study Group (ICSG) data, the refined copper market balance for May (latest available) showed a monthly apparent production deficit, at more than 60,000 metric tons (mt), mainly due to strong Chinese apparent demand. When making seasonal adjustments for world refined production and usage, May showed a production deficit of around 30,000 mt. The refined copper balance for the first five months of 2015 indicated a roughly balanced market.
China’s apparent copper usage in May was the highest since December 2014. Excluding China, which accounts for about 40% of copper consumption, world usage declined by around 3% in the first five months of 2015. Meanwhile, the ICSG estimated that copper mine production worldwide increased by 3.6% in the first five months of 2015 compared with production in the same period of 2014.
World refined copper production is estimated to have increased by 3% (261,000 mt) in the first five months of 2015 compared with refined production in the same period of 2014: primary production was up by almost 2% and secondary production (from scrap) was up by 8.2%. The main contributor to growth was China (up by 5%).
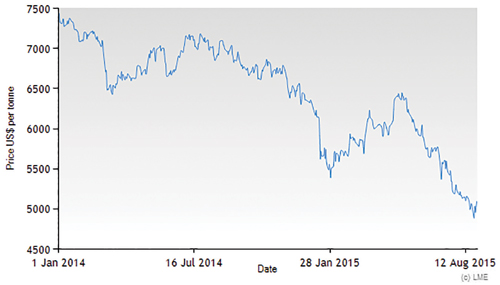
The average LME cash price for July was $5,456.91/mt, down from the June average of $5,833.61/mt. The highest copper price for 2015 was $6,448.00 (May 12) and the current $5,095/mt is the low point for the year. As of the end of July, copper stocks held at the major metal exchanges totaled more than 483,000 mt, an increase of more than 177,000 t (58%) from stocks held at the end of December 2014.