By Steve Fiscor, Editor-in-Chief
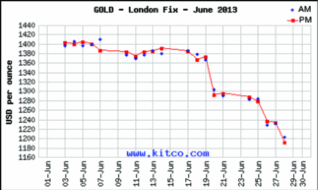
When E&MJ alluded to the fact that the worst might be yet to come for gold in the May Markets column, it became a self-fulfilling prophecy in June. Hedge funds were liquidating gold holdings in exchange-traded funds in April. Gold sellers managed to claw some back in May before the market was sacked in June.
 The second quarter of 2013 closed with a 23% loss for gold prices—the worst quarterly decline since modern trading began in the 1970s. On April 2, the price of gold stood at $1,583.50/oz. It fell to $1,192/oz on June 28, the last trading day of the second quarter. The gold market has not seen prices this low since August 10, 2010. From that point in time, prices grew at a relatively rapid pace to a high of $1,895/oz on September 5, 2011.
Believing that the U.S. economy was improving and seeing few signs of inflation, the U.S. Federal Reserve signaled it would consider tightening monetary policies during the week of June 24, which added strength to the U.S. dollar and created turbulence with stock markets and commodity exchanges. The stock market would recover quickly with bargain hunters buying on the dip, but commodities had not as of press time.
In fact, analysts and some serious mining investors were still wondering whether gold prices had reached a technical floor. Appearing on CNBC’s Fast Money, Sprott U.S. Holdings Chairman Rick Rule referred to the recent gold market activity as capitulation selling by investors. Sprott Investments is a Toronto-based capital fund that supports gold mining and exploration. While Rule stayed the course, bullish on gold and gold mining stocks in particular, he admitted that anything can happen when the market enters a period of capitulation selling, and both gold and gold mining companies could lose more value in the short term. Precious metals analysts have made predictions that range from prices as low as $1,000/oz during the third quarter to as high as $1,400/oz by the end of the year. Forecasts with such a widespread variation indicate that no one knows for sure what the future holds.
Falling 10.7% during June, gold as it usually does, grabbed most of the headlines, but other precious metals suffered too; silver was down 12.9% and platinum and palladium were both down 9.4%. Metals prices softened across the board during June with the exception of minor metals and iron ore. All of the non-ferrous base metals were down as well: aluminum (9%), copper (5.4%), lead (6.6%), nickel (7.3%), tin (5.5%) and zinc (8%).
E&MJ PRICES INDEX
(July 1, 2013)
| Precious Metals ($/oz) | Base Metals ($/mt) | Minor Metals ($/mt) | Exchange Rates (U.S.$ Equivalent) | ||||
| Gold | $1,252.60 | Aluminum | $1,754.00 | Molybdenum | $23,200 | Euro (€) | 1.3036 |
| Silver | $19.65 | Copper | $6,917.00 | Cobalt | $32,300 | U.K. (£) | 1.5221 |
| Platinum | $1,370.00 | Lead | $2,059.00 | Canada ($) | 0.9515 | ||
| Palladium | $685.00 | Nickel | $13,835.00 | Iron Ore ($/dmt) | Australia ($) | 0.9189 | |
| Rhodium | $1,000.00 | Tin | $19,755.00 | Fe CFR China | $116.75 | South Africa (Rand) | 0.1010 |
| Ruthenium | $85.00 | Zinc | $1,833.00 | China (¥) | 0.1619 | ||
Gold and silver prices provided by KITCO Bullion dealers (http://www.kitco.com). Platinum group metals prices provided by Johnson Matthey (http://www.platinum.matthey.com).
|
|||||||


