


By benchmarking readily available data, mining companies can model operations to determine the influence of different variables and make comparisons on a peer-to-peer basis
By Steve Fiscor, Editor-in-Chief
Those who track efficiencies in the mining business say that overall productivity is declining. Meanwhile, the cost to move a ton of ore continues to climb and many mines have to move more tons to recover the same amount of metal. Mining companies face multiple factors that impact economics. Many of these, such as demand volatility, challenging geology and more stringent health and safety standards, are beyond the production manager’s control. There is, however, always room for improvement in the pit and at the mill. Operations managers can directly influence productivity. The key is determining where the operation(s) stand for benchmarking purposes and peer-to-peer comparisons. Using advanced analytics to parse the data currently available, they can build a site-specific model that allows them to see the outcome when they tinker with the inputs.
MineLens, a service provided by McKinsey Solutions, is building a massive database of equipment and performance related data for mining companies worldwide. Speaking at the International Mine Exhibition (IMEX), which was held during October in Las Vegas, Dr. Nathan Flesher, director of operations for MineLens, discussed the data the company has been compiling and the services it now offers its customers. “Two of the areas where we invest most of our time are granular benchmarking, really understanding the performance of operations and how to make improvements based on advance analytics,” Flesher said.
A digital data revolution is taking place and mines are already beginning to capitalize on it. From 1986 to 2007, the amount of data generated grew exponentially from 300 exabytes to 25,500 exabytes, and probably 120,000 exabytes in 2010, Flesher explained. “Each year, we are creating as much data everywhere in the world as was created previously in the history of man,” Flesher said. “How can we effectively collect, manage, interpret and use the data? Fortunately, most of the new data is digital, which improves the chances of it being properly ingested.”
Many mines have implemented lean management concepts as well as total quality management, and Big Data will likely be the next tool for mining companies to increase profitability. Fleet management systems know where every piece of equipment is located and how it’s being used. Mineral processing plants are pumping out loads of data. Card systems and tags track miners and assets from the time they arrive on the property until they leave. The mines have the data and the tools to work with it, but they need to determine what to do with it. With all of the data available, Flesher explained, a manager could spend a lot of time in a data hole and accomplish nothing.
Manufacturing plants that are using Big Data effectively see the operation more clearly in real time by creating transparency. They build models and experiment with different scenarios to discover needs, expose variability and improve performance. By segmenting the data, they can customize actions. They could replace or support some of the decisions made by the management team with automated algorithms.
As an example, Flesher suggested a component, a truck suspension and the decision to run to failure. What kind of impact would that have on the operation? Does it save money on maintenance? The models are based on mine-specific equipment and they could adapt to different conditions. “We could augment or replace human decisions,” Flesher said. “A mining company does not necessarily need a production manager with 30 years of experience making every decision. The system could make some decisions for them, so that they can focus on more complex issues.”
 |
| A query of the latest MineLens data for haul trucks found a large amount of hidden process delays. |
GRANULAR BENCHMARKING
Granular benchmarking and asset productivity (reliability and maintenance) with Big Data are two areas where MineLens concentrates. They manage a large data set across multiple commodities, roughly 100 mines with data on 4,000 trucks, 700 electric shovels, 400 front-end loaders and 150 crushers. Using this system, they can compare operating, labor and cost performance benchmarks to a global set of peers.
The one question Flesher said he is asked at every mine site is: How do we compare with similar operators in other locations? Mine managers spend most of their time at their site and rarely get a chance to compare notes with peers. “We can tell people how they compare to others and how they can improve their operations,” Flesher said.
Using “rigorous” benchmarking methodology based on proprietary normalization algorithms and analytics, MineLens claims they can identify opportunities to improve productivity while reducing costs and capital expenditures. They also measure performance improvement over time. “We spent quite a bit of time normalizing and crunching that data to compare apples to apples,” Flesher said. “The dig rates on a shovel used for iron ore and overburden at a coal mine will differ substantially. Once the material is in the truck, however, the truck would essentially perform the same. The truck’s performance depends more on the haul routes and elevation changes.”
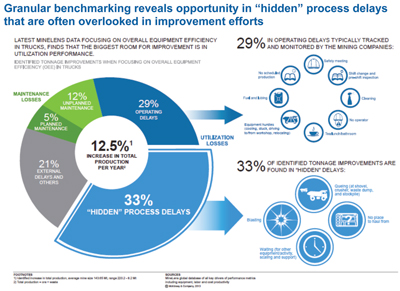
Granular benchmarking gives an operation a common language to discuss performance and a way to make comparisons and measure improvement over time. It also reveals hidden process delays that are often overlooked with other improvement efforts. Managers can zero in on one aspect of the operation that is underperforming and unlock constraints.
A query of the latest MineLens data focusing on overall equipment efficiency with haul trucks found that the biggest room for improvement is in utilization performance. “We looked at all haul trucks to determine where operations were losing time,” Flesher said. “Oftentimes, production blames maintenance. When we looked at the delays on haul trucks, we found that maintenance represented 17% of the delays on haul trucks. That’s significant, but 33% of the delays were hidden process delays.” The reasons for the hidden delays ranged from blasting to queing at the shovels to no place to haul from and waiting on other equipment/activity. These overlooked delays represent a huge hidden factor for truck fleet optimization.
 |
| The query for haul truck performance did not show much change in availability over time. |
Another reason often voiced for delays is older equipment operating in poor condition. While that might be true, the database query for haul truck performance over time doesn’t show much of a change in availability. With good maintenance practices and operator behavior, equipment can run much longer than the time periods some mines use for their models, Flesher explained. “Older trucks do break down more often, but the miners know this and they have the parts on hand and they know how to repair it,” Flesher said. “A new truck breaks down and the parts might not be readily available and the repair might take longer because of a lack of experience.”
Cost benchmarking allows users to quantify potential improvement opportunity. When a mine reviews its total cost per ton of material moved, it will reveal where it lies on the cost curve for both maintenance and operations. A mine’s maintenance costs might be higher than average, while the operating costs are in line. If total costs are higher than one would expect, and maintenance and operations costs are in line, then external conditions may have changed, such as geology or the cost for supplies.
Most miners understand that re-handling material or hauling excess waste increases costs. Viewing this through a site-specific model demonstrates it more clearly.
By comparing equipment availability and utilization, managers can see where they stand vs. median and top quartile benchmarks. If a comparison is made between similar equipment spreads, management could see the effects of planned vs. unplanned maintenance as well as the difference between over- and under-maintained spreads. From there, they can determine a sweet spot for operations.
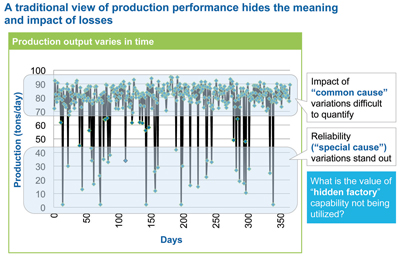 |
| A Weibull analysis shows that this operation has a number of bad days, but the cumulative effect of the common cause for losses has a much greater impact. |
ADVANCED ANALYTICS & WEIBULL ANALYSIS
Benchmarking tells a person where to look. Advanced analytics prove that an opportunity to improve exists. With Big Data and advanced analytics, techniques such as a Weibull analysis, can be used to make predictions for an equipment population by fitting a statistical distribution to data from a sample of that population.
Mines measure production in tons per day. A traditional view of production performance hides the meaning and impact of losses (See Weibull analysis). The impact of common cause variations are difficult to quantify. Failures due to reliability stand out. These are the really bad days, Flesher explained, and people tend to focus the most on these. “The shovel is down, the COO is on the phone, etc.,” Flesher said. “All of those little delays in the top zone add up to a larger source of loss. What’s the hidden factor there? What’s the latent capacity?”
By plotting data on a log-log chart, daily production can be viewed as a function of reliability. Looking at a Weibull estimate for four shovels operating in iron ore (See Weibull estimate), losses tend to be due to common causes rather than special causes such as major failure events. “In this case, their bad days are relatively rare,” Flesher said. “They need to focus on their common cause failures.”
This type of analysis can also provide an analytical representation of nameplate capacity. “When a plant commissions a new crusher, whether or not the manufacturer has sandbagged the actual capacity, the mine at least has a number they can compare to,” Flesher said. “Determining the nameplate capacity for a truck-shovel operation is not so easy. There are many variables that relate to how those pieces of equipment interact. It’s often difficult to say what the daily production target should be.”
“That’s one of the challenges we face with benchmarking,” Flesher said. “Determining if a piece of equipment is broken or not is easy. It’s a little harder, but not overly difficult, to say that the equipment is operating. At what rate should that equipment be operating at? That is a really difficult question to answer.” What the mining business needs is a way to analytically determine the capacity for the current production system as its configured now. This type of advanced analysis of the benchmarked data can give yield to these answers.
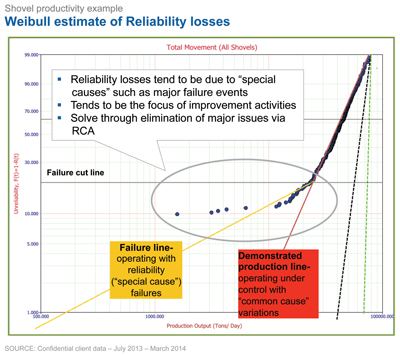 |
| By plotting data on a log-log chart, daily production can be viewed as a function of reliability. |
IMPROVING ASSET PRODUCTIVITY
A North American copper mine operating 25 haul trucks believed they were spending too much on maintenance. They looked at failure data to determine failure modes and the optimal replacement frequency. They leveraged condition data and alarms to determine impending failures. They implemented changes in their maintenance policy and processes and established supporting tools. They made changes to run some components to failure while replacing others early. With $0 cash cost of implementation, they recouped $5 million over seven years.
A standard four-step process was used to calculate the optimal replacement timing for major haul truck components. Tests were conducted to ensure all trucks had the same stress conditions. “Contour plots were developed using Weibull analysis,” Flesher said. “If the plots overlap, then it is likely that all of the trucks are subject to the same stress condition.”
They conducted failure disruption analysis to determine the characteristics of the dominant failure mode(s). That information was used to determine the optimal maintenance strategy. “This isn’t something that happens by itself,” Flesher said. “It’s also not extremely complicated. The data can be assembled at the mine site.”
MineLens assisted another mid-sized, open-pit mine. Recovering from the global financial crisis, they decided to high-grade the mine. They eventually fell behind in waste stripping. “So we helped them establish benchmarks,” Flesher said. “Based on the current performance, and looking at the next quartile, they realized they had about 7% to 16% additional load and haul capacity. They also had some cost levers as far as improved tire life, diesel consumption, etc.”
MineLens worked with them, identified opportunity and benchmarked performance. They did well in year one and made further improvements in year two. In the first year, truck availability improved 13% with another 5% to go,” Flesher said. “They reduced the queing time from 12% to 1%.” They realized the trucks were idling a lot, so they decided to fully utilize their auto-dispatching system.” These are two examples of what mines can do when they take the time to look at their data in context and act on it.


